Watercolor Future Market Outlook Line Graph
RJ0600049_16
- Last Update 07/03/2025
- File Size 8.7MB
- # of Slides 2
- File Format PPTX
- Slide Ratio 16:9
- Color
Keywords
About the Product
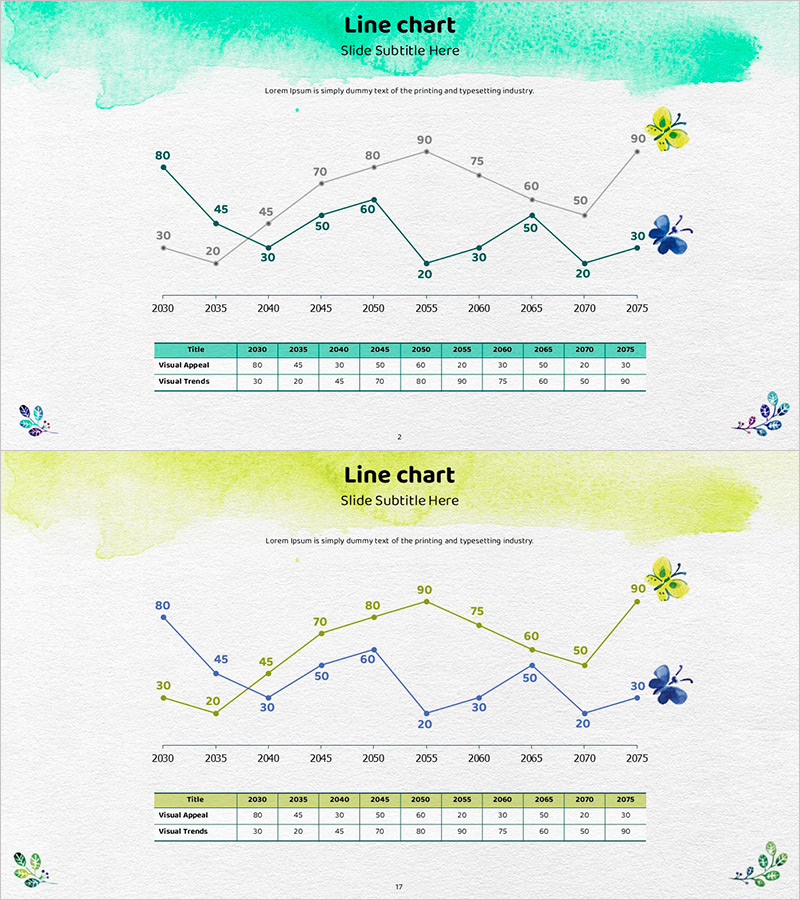
A visually engaging line chart PowerPoint slide featuring a watercolor aesthetic with dual data series tracking market trends from 2030 to 2075. The design combines turquoise and lime watercolor header elements with clear data point markers that represent two distinct metrics over time. A comprehensive data table at the bottom provides exact numerical values alongside the visual trend representation. This presentation slide is ideal for business reports, market analysis presentations, financial forecasts, and strategic planning documents where long-term trend comparison is essential.
Usage Points
-
Main Usage
Effectively compare two related metrics across an extended time period, revealing trend patterns and correlation between data series. The connected data points create a clear visual narrative of change, while the accompanying table ensures numerical accuracy and transparency.
-
How to Use
Insert this slide into market analysis sections, business performance reports, investor presentations, or strategic forecasting decks. Simply update the data table with your figures, and the line chart automatically reflects the changes, making customization quick and seamless.
-
Recommended For
Marketing strategists, business analysts, financial professionals, and executives presenting market trends or performance metrics. Particularly effective when demonstrating the relationship between two key indicators or highlighting diverging trend patterns.
-
Slide Structure
Watercolor header band (turquoise and lime gradient), dual-line chart with 10 data points per series, colored data markers, horizontal axis spanning 2030–2075, data table with 3 rows and 11 columns, decorative floral icons. 16:9 format, 2-slide set.
Related Products
-

Trend Analysis of Drug Response – Market and Competitor Analysis
#Market and Competitor Analysis #Graph #Future Outlook
-

Trend Color Wide Template Line Chart – Market Trend Analysis
#Market and Competitor Analysis #Graph #Future Outlook
-

A Continuously Growing Broken Line Graph – Market Trends and Future Outlook
#Market and Competitor Analysis #Graph #Future Outlook
-

Current Status and Prospects of Cultivation – Market Analysis Graph
#Market and Competitor Analysis #Graph #Future Outlook
