Simple & Modern Donut Chart PowerPoint – Essential for Business Strategy Development
RJ0200058_10
- Last Update 04/15/2025
- File Size 0.1MB
- # of Slides 2
- File Format PPTX
- Slide Ratio 16:9
- Color
Keywords
- #Content-Based Slides
- #Design-Based Slides
- #Business Strategy
- #Marketing Plan and Strategy
- #Graph
- #Marketing Objectives
- #Circles
- #Doughnut Chart
- #Project Progress
- #16:9
- #donut chart PowerPoint
- #pie chart presentation slide
- #ratio comparison template
- #business progress visualization
- #data chart slide download
About the Product
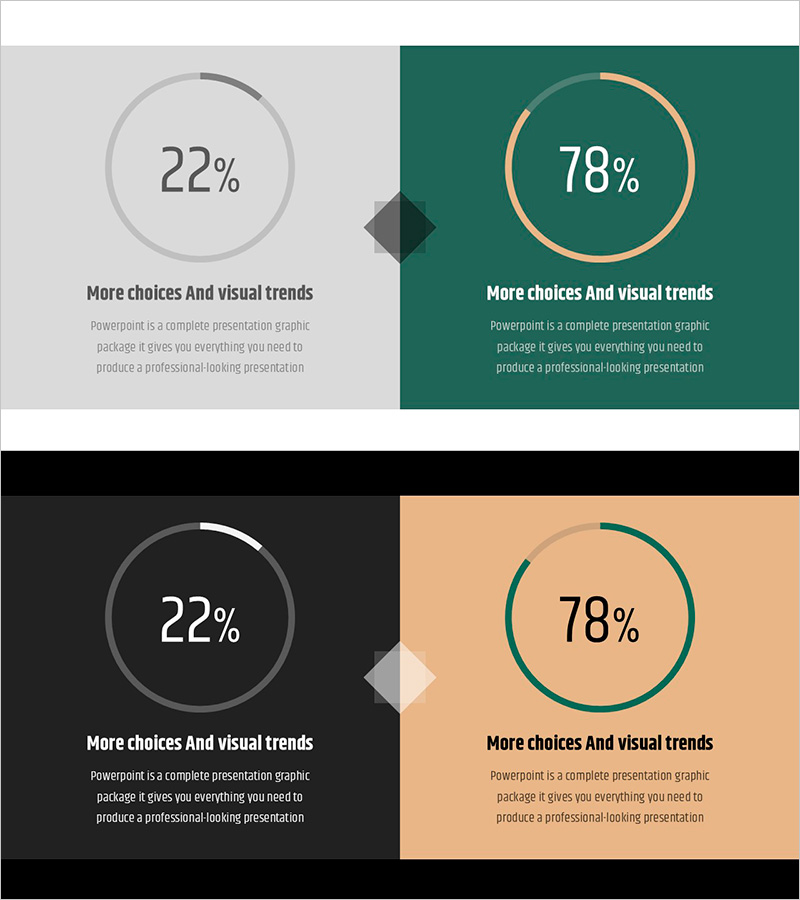
A donut chart PowerPoint slide designed to visualize business progress and performance metrics. The template features two distinct layouts: one with a gray background and gray-bordered circular chart showing 22%, and another with a dark teal background and gold-bordered chart displaying 78%. Each slide includes a title area and descriptive text space, making it ideal for presenting comparative data such as project completion rates, goal achievement percentages, and business performance indicators. The 16:9 widescreen format with 2-slide composition is ready for immediate use in presentations.
Usage Points
-
Main Usage
Visualize contrasting business metrics such as project completion rates, goal achievement percentages, and performance indicators using donut charts. The center space of each donut allows for placing key figures or titles, maximizing information clarity and impact.
-
How to Use
Use in business meetings, progress reports, and strategy presentations to display completion rates, success percentages, and performance data. Edit the percentages and titles to match your actual data, and customize background and chart colors to align with your presentation theme.
-
Recommended For
Business managers, project coordinators, and executives presenting progress reports benefit from this template. It is particularly effective when comparing two opposing metrics such as completed versus pending tasks, achieved versus unmet goals, or success versus failure rates.
-
Slide Structure
The template consists of 2 slides, each featuring one donut chart. The first slide has a gray background with a gray-bordered chart (22%), while the second features a dark teal background with a gold-bordered chart (78%). Both slides include title and descriptive text areas below the charts for context and explanation.
Related Products
-

Visualization Slide for Preference in Online Learning
#Market and Competitor Analysis #Marketing Plan and Strategy #Diagram
-

Modern Blue Presentation Doughnut Chart 2 – Visualizing Business and Investment Performance
#Business Strategy #Financial Plans and Performance #Graph
-

Effort and Challenge Silhouette Diagram – Marketing Strategy Representation
#Business Strategy #Marketing Plan and Strategy #Diagram
-

Identity Wide Template – Representative Introduction with Doughnut & Column Charts
#Business Strategy #Market and Competitor Analysis #Graph
