Market Analysis Visualization with Bar Chart – Your Competitive Advantage Slide
RJ0200008_29
- Last Update 03/30/2025
- File Size 3.3MB
- # of Slides 2
- File Format PPTX
- Slide Ratio 16:9
- Color
Keywords
- #Content-Based Slides
- #Design-Based Slides
- #Market and Competitor Analysis
- #Financial Plans and Performance
- #Graph
- #Competitor Analysis
- #Sales and Revenue
- #Horizontal Bar
- #Double Horizontal Bar
- #16:9
- #horizontal bar chart PowerPoint
- #bar graph slide template
- #market analysis chart
- #data comparison presentation
- #competitive analysis graph
About the Product
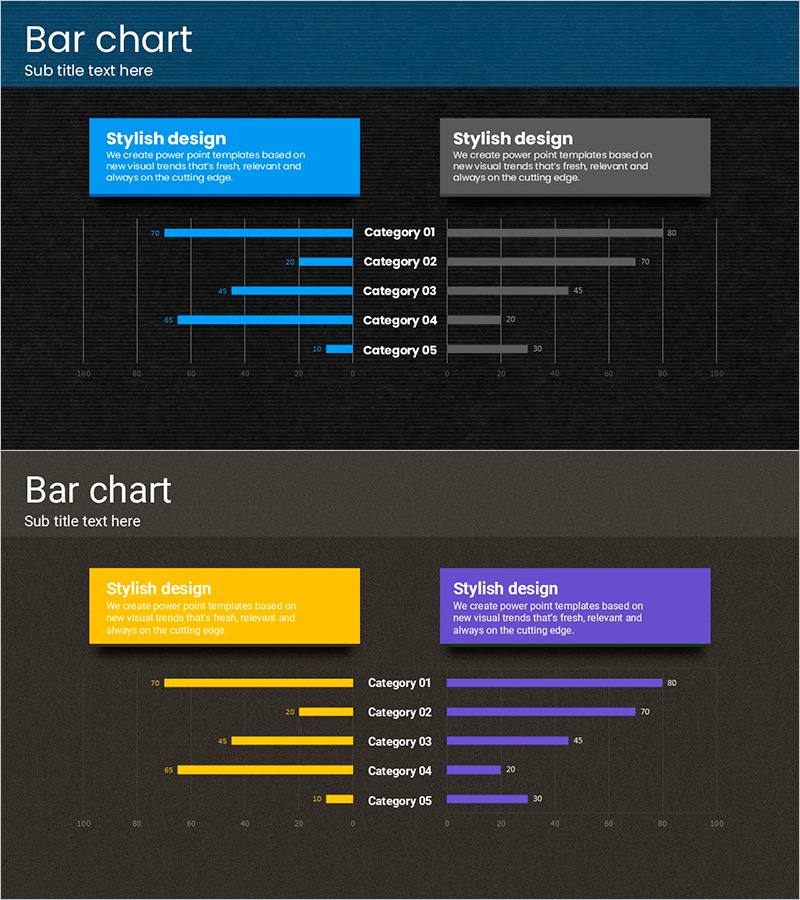
A horizontal bar chart PowerPoint slide optimized for market analysis and competitive comparison. Set against a dark background, this presentation template features three color series (blue, yellow, and purple) to compare data across five categories simultaneously, with numerical labels displayed at the end of each bar for precise information delivery. Instantly applicable to financial performance reports, revenue analysis, market share assessments, and competitive positioning presentations.
Usage Points
-
Main Usage
Visualize and compare numerical data across five categories for market analysis, competitive benchmarking, financial performance, and revenue metrics. The dark background with contrasting blue, yellow, and purple bars creates strong visual impact and maintains audience focus on key data points.
-
How to Use
Replace category labels and bar values with your own data. The 2-slide set provides a blue-series version and a yellow-purple mixed version, allowing you to select the appropriate design for your presentation flow. Colors and values are fully editable using standard PowerPoint tools.
-
Recommended For
Executive reports, quarterly earnings presentations, marketing strategy meetings, investor pitch decks, and consulting proposals requiring quantitative data visualization. Ideal for finance teams, marketing departments, business planning units, and sales teams making data-driven decisions.
-
Slide Structure
2-slide set. Each slide features two text boxes at the top (blue and gray backgrounds) with descriptive content, and a horizontal bar chart below displaying five categories (Category 01–05). Bars are scaled on a 0–100 horizontal axis with numerical labels at the end of each bar for precise value representation.
Related Products
-

Social Distancing Vaccination Rate Comparison Graph – Essential Tool for Market Analysis
#Market and Competitor Analysis #Financial Plans and Performance #Graph
-

ABSTRACT PATTERN Presentation BAR CHART – Market and Financial Analysis
#Market and Competitor Analysis #Financial Plans and Performance #Graph
-

Sales Comparison Graph by Product – Competitive Advantage and Performance Analysis
#Market and Competitor Analysis #Financial Plans and Performance #Graph
-

Office Supplies Theme Double Bar Graph – Clear Visualization of Data
#Market and Competitor Analysis #Graph #Competitor Analysis
