Sales Comparison Graph by Product – Competitive Advantage and Performance Analysis
RJ0900033_9
- Last Update 08/26/2025
- File Size 0.2MB
- # of Slides 2
- File Format PPTX
- Slide Ratio 16:9
- Color
Keywords
- #Content-Based Slides
- #Design-Based Slides
- #Market and Competitor Analysis
- #Financial Plans and Performance
- #Graph
- #Competitive Advantage
- #Sales and Revenue
- #Horizontal Bar
- #Double Horizontal Bar
- #16:9
- #diverging bar chart PowerPoint
- #left-right comparison graph
- #4-item comparison slide
- #sales comparison template
- #competitive analysis chart
About the Product
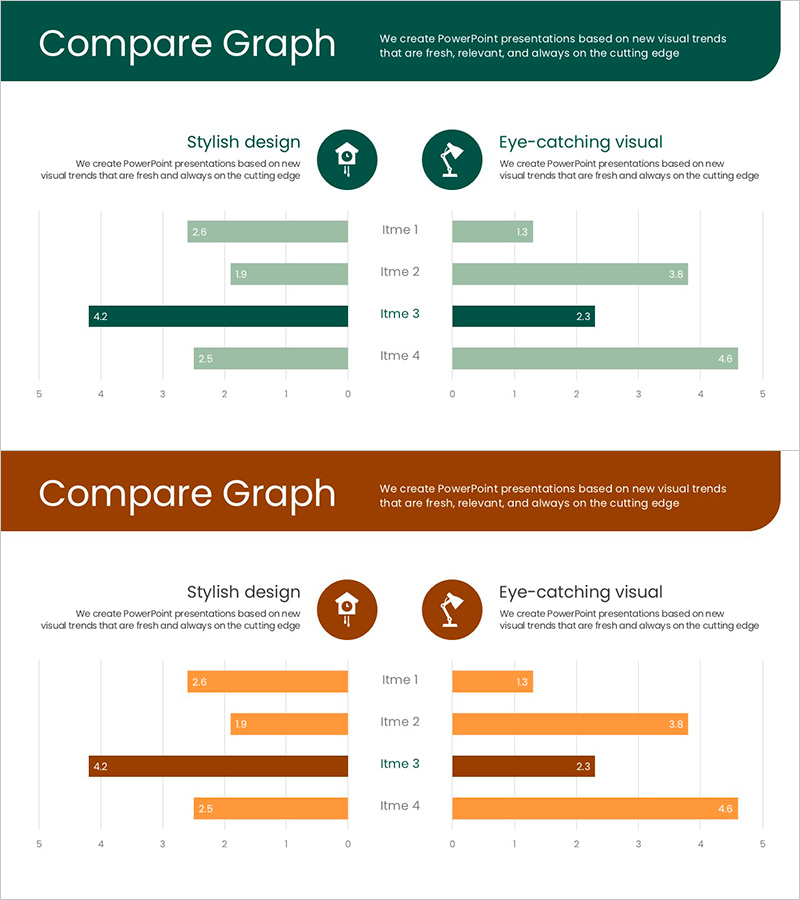
A diverging bar chart PowerPoint slide template for comparing product sales performance with left-right symmetry. Displays four data items simultaneously using teal and orange color schemes with light accent tones to emphasize contrast. Each item features opposing data series on the left and right sides, making it ideal for competitive advantage analysis, market share comparison, and departmental performance metrics. Ready-to-use presentation slide for reports and business decks.
Usage Points
-
Main Usage
Compares two data series side-by-side using diverging bars to visualize product sales performance, market share distribution, and competitor benchmarking. Enables intuitive numerical comparison for strategic decision-making and performance analysis.
-
How to Use
Insert into financial reports' performance analysis sections, marketing plans' market analysis pages, or business proposals' competitive positioning slides. Edit bar values to reflect actual data and adjust colors to match corporate branding guidelines.
-
Recommended For
Finance teams presenting quarterly earnings, marketing teams analyzing market positioning, executive strategy meetings, and investor pitch decks. Suitable for product line comparisons, regional sales performance tracking, and departmental KPI analysis.
-
Slide Structure
Two-slide set featuring teal and orange background variants. Each slide displays 4 items (Item 1–4) with opposing horizontal bars on left and right sides. Numerical values appear at bar endpoints. Header area includes 'Stylish design' and 'Eye-catching visual' icons with descriptive text.
Related Products
-

Real Estate Interactive Horizontal Bar Graph – Market Analysis and Performance
#Market and Competitor Analysis #Financial Plans and Performance #Graph
-

Green Red Interactive Bar Graph
#Market and Competitor Analysis #Graph #Competitive Advantage
-

Competitive Advantage 3D Bi-directional Bar Graph – Essential Tool for Market Analysis
#Market and Competitor Analysis #Graph #Competitor Analysis
-

Simple Circle Presentation Template Bilateral Bar Graph
#Market and Competitor Analysis #Graph #Competitive Advantage
