Touch Wide Slide Template – Vertical Bar Chart Application
RJ0200008_16
- Last Update 03/30/2025
- File Size 4.6MB
- # of Slides 2
- File Format PPTX
- Slide Ratio 16:9
- Color
Keywords
- #Content-Based Slides
- #Design-Based Slides
- #Operational Plan
- #Financial Plans and Performance
- #Graph
- #Risk Management
- #Sales and Revenue
- #Column
- #Grouped Column
- #16:9
- #vertical bar chart PowerPoint
- #column chart slide template
- #risk management data visualization
- #comparative analysis presentation
- #business report slides
About the Product
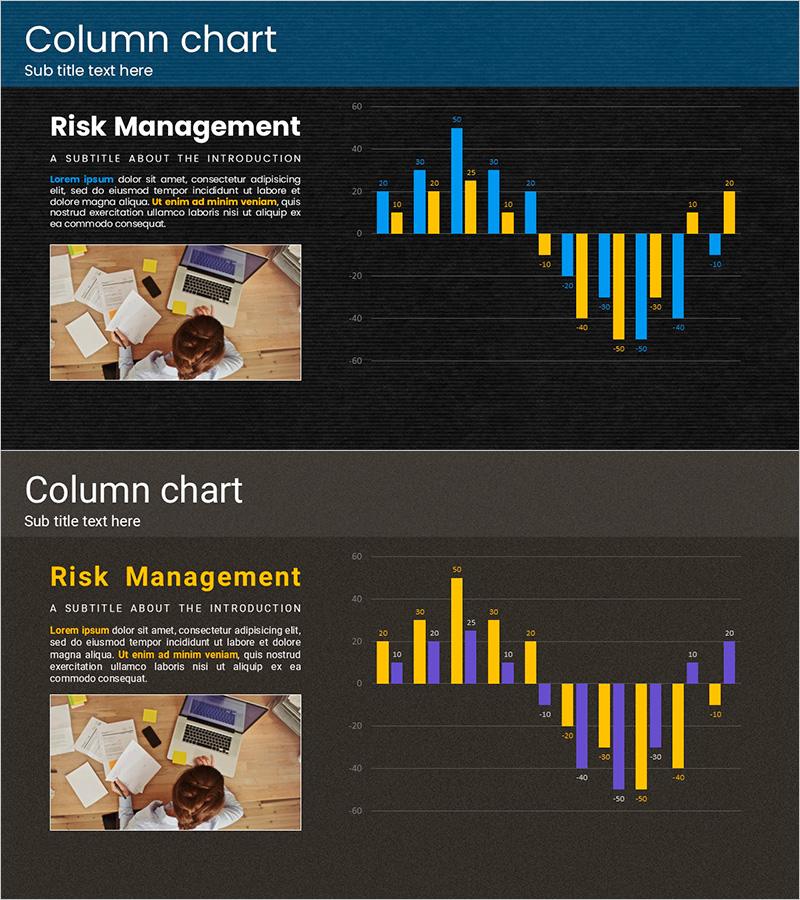
A 2-slide PowerPoint presentation featuring vertical bar charts for risk management topics. The dark background design uses three color series—blue, yellow, and purple—to clearly compare positive, negative, and neutral data points. The balanced layout combines an image area on the left with the chart on the right, making it immediately applicable to presentations and reports. Delivered in 16:9 widescreen PPTX format, fully editable in all PowerPoint versions.
Usage Points
-
Main Usage
Visualize multi-series data comparisons in risk management, financial analysis, and performance reviews using vertical bar charts that simultaneously display positive, negative, and neutral indicators. The professional dark-background design suits executive briefings, investor presentations, and consulting materials.
-
How to Use
Slide 1 features a title, subtitle, descriptive text, with a related image on the left and chart on the right. Slide 2 uses a chart-focused layout with expanded graph space. Simply replace the bar values, legend labels, and axis titles with your own data for immediate use.
-
Recommended For
Finance teams, executives, consultants, analysts, and project managers presenting quarterly performance, risk assessments, budget comparisons, and market analysis. Also effective for academic presentations, thesis defenses, and corporate training seminars requiring data credibility.
-
Slide Structure
2-slide set. Slide 1: Title area (top), image area (left), text description (center), vertical bar chart (right). Slide 2: Title and subtitle (top), vertical bar chart (center to bottom) in full layout. Each chart displays 6–8 data items across 3 series (blue, yellow, purple).
Related Products
-

Triangle Pattern Column Chart Presentation Template
#Market and Competitor Analysis #Financial Plans and Performance #Diagram
-

Analyze Sales Performance with Geometric Pattern Wide Bar Chart
#Market and Competitor Analysis #Financial Plans and Performance #Graph
-

Sales Response Strategies for High and Low Points Presentation Slide
#Operational Plan #Financial Plans and Performance #Graph
-

Hologram Wide PowerPoint Area Chart – Embodying Contemporary Sensibility
#Operational Plan #Financial Plans and Performance #Graph
