Simple Car Wide Presentation Vertical Bar Chart
RJ0200057_9
- Last Update 04/15/2025
- File Size 0.4MB
- # of Slides 2
- File Format PPTX
- Slide Ratio 16:9
- Color
Keywords
- #Content-Based Slides
- #Design-Based Slides
- #Market and Competitor Analysis
- #Financial Plans and Performance
- #Graph
- #Market Analysis
- #Sales and Revenue
- #Column
- #Grouped Column
- #16:9
- #automotive sales chart PowerPoint
- #vertical bar graph presentation
- #market analysis slide
- #car sales data visualization
- #comparison chart template
About the Product
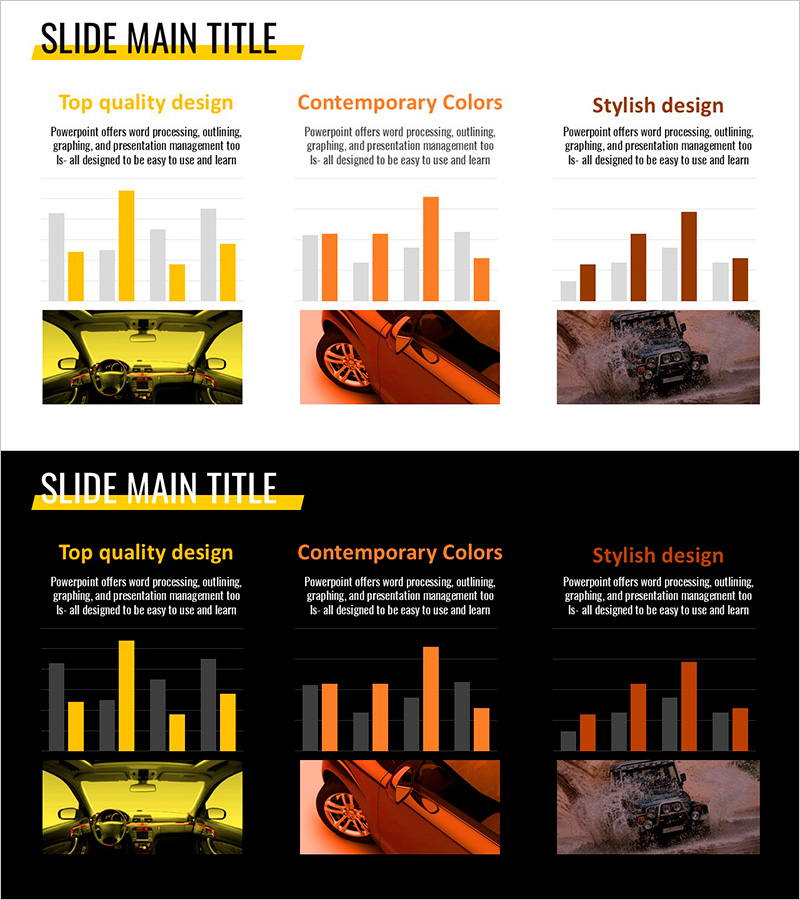
A vertical bar chart PowerPoint slide optimized for automotive industry presentations. This slide deck features a multi-series bar graph with yellow, orange, and brown color schemes, enabling side-by-side comparison of sales volume, market share, customer satisfaction, and other key metrics. Provided in 16:9 widescreen format with 2 slides, each layout combines data visualization with automotive imagery for immediate use in market analysis, competitive benchmarking, and sales performance reports. All chart elements are fully editable—simply input your data and the chart updates automatically.
Usage Points
-
Main Usage
Visualize automotive industry market analysis, sales performance, and competitive benchmarking data using a multi-series vertical bar chart. The 3-series bar structure allows simultaneous representation of multiple metrics such as sales volume, market share, and customer satisfaction for comprehensive data comparison.
-
How to Use
Input actual sales data, market statistics, or competitor figures into each bar chart element, and the visualization updates automatically. Replace the automotive image area with product photos, logos, or brand imagery. Customize title and description text to match your presentation topic and data context.
-
Recommended For
Automotive manufacturers and dealers, automotive industry analysts, marketing and sales professionals, automotive engineering students, and anyone preparing industry reports, business proposals, or quarterly performance presentations.
-
Slide Structure
2-slide deck with consistent layout: title and description text at top, 5-item × 3-series vertical bar chart in center, and automotive imagery at bottom. Bars are color-coded in yellow, orange, and brown to represent different data metrics. Both light gray and black background versions are included for flexible presentation design.
Related Products
-

Animal Nature Conservation Program Facility Investment Plan Chart
#Market and Competitor Analysis #Financial Plans and Performance #Graph
-

Revenue Vertical Bar Chart – Innovation in Market Analysis
#Market and Competitor Analysis #Financial Plans and Performance #Graph
-

Performers and Bundled Charts – Sales and Revenue Analysis
#Market and Competitor Analysis #Financial Plans and Performance #Graph
-

Sales and Profit Table – Visualizing Financial Performance
#Market and Competitor Analysis #Financial Plans and Performance #Diagram
