Sales Response Strategies for High and Low Points Presentation Slide
RB0800039_4
- Last Update 03/25/2025
- File Size 1.6MB
- # of Slides 2
- File Format PPTX
- Slide Ratio 4:3
- Color
Keywords
- #Content-Based Slides
- #Design-Based Slides
- #Operational Plan
- #Financial Plans and Performance
- #Graph
- #Risk Management
- #Sales and Revenue
- #Line
- #Line Chart
- #4:3
- #line chart PowerPoint
- #sales trend analysis slide
- #dual-series comparison template
- #quarterly data visualization
- #business presentation slide download
About the Product
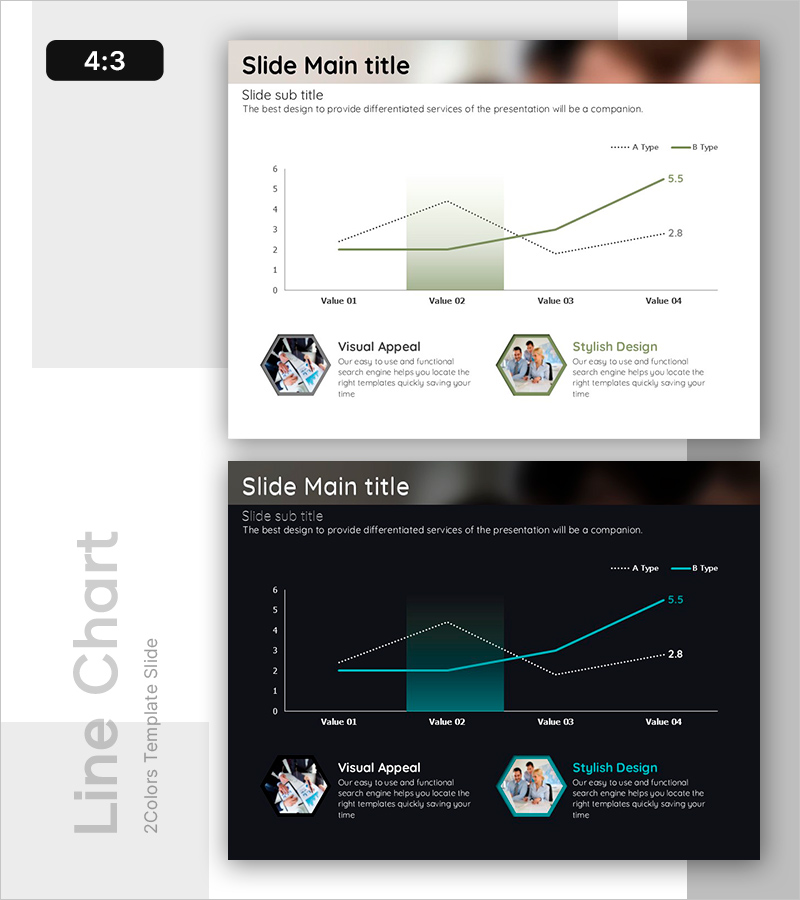
A dual-series line chart PowerPoint slide for comparing sales trends across four quarters (Value 01–04). The design uses a dotted line for A Type and a solid line for B Type, with a green area highlight in the center to emphasize key periods. The light-tone background makes it ideal for immediate use in business presentations covering sales response strategies, operational planning, and financial performance analysis. Two-slide template includes both light and dark theme versions for flexible presentation needs.
Usage Points
-
Main Usage
Visualize numerical changes over time across two data series, such as quarterly sales, market trends, or performance metrics. The dotted and solid line distinction allows comparison of forecasted vs. actual results, or performance across two business divisions simultaneously.
-
How to Use
Use in financial reports, business performance presentations, and operational review meetings to explain quarterly or monthly trends. Modify the center highlight area to mark key inflection points or critical periods, and update the legend labels (A Type, B Type) with actual data names for immediate presentation use.
-
Recommended For
Finance teams, sales departments, executive briefings, quarterly performance reviews, and market response strategy sessions. Particularly valuable for CFOs, business unit heads, marketing managers, and professionals responsible for sales response strategies, risk management, and market analysis.
-
Slide Structure
Dual-series line chart with 4 data points (Value 01–04) using dotted line for A Type and solid line for B Type. Features a green area highlight in the center and two hexagonal text boxes at the bottom (Visual Appeal, Stylish Design) for additional descriptions.
Related Products
-

Purple Green Flower Market Analysis – Market Status and Competitive Analysis
#Market and Competitor Analysis #Financial Plans and Performance #Graph
-

Highlighting Key Data Points in Trends – Performance and Vision
#Business Strategy #Financial Plans and Performance #Graph
-

Visualize Performance with Line Graph Trends – Business Strategy
#Business Strategy #Financial Plans and Performance #Graph
-

Cost Increase Rate Analysis Chart
#Financial Plans and Performance #Diagram #Graph
