Visualizing Market Analysis with Line Chart – Securing Competitive Advantage
RJ0200008_14
- Last Update 03/30/2025
- File Size 3.3MB
- # of Slides 2
- File Format PPTX
- Slide Ratio 16:9
- Color
Keywords
- #Content-Based Slides
- #Design-Based Slides
- #Market and Competitor Analysis
- #Marketing Plan and Strategy
- #Graph
- #Competitive Advantage
- #Target Market Strategy
- #Line
- #Line Chart
- #16:9
- #line chart PowerPoint slide
- #dual-series line graph
- #trend analysis template
- #time-series data visualization
- #PowerPoint chart slide download
- #how to create line chart in PowerPoint
About the Product
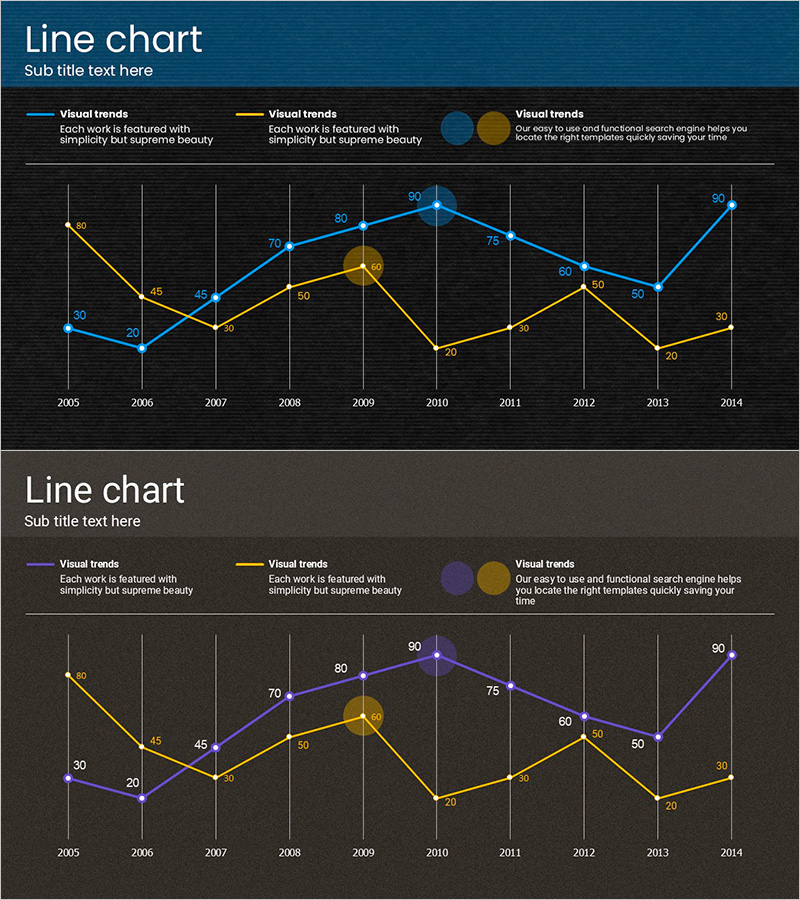
A dual-series line chart PowerPoint slide that compares two data trends over a 10-year period from 2005 to 2014. The slide features a dark background with blue and gold lines representing two distinct data series, each with clearly labeled data points showing exact values. Vertical grid lines divide the chart by year, making period-to-period comparison intuitive. This design is ideal for presenting market trends, competitive benchmarking, sales performance, and strategic analysis in business presentations, marketing reports, and executive briefings. The 16:9 widescreen format includes 2 fully editable slides ready for immediate use.
Usage Points
-
Main Usage
Visualize and compare two or more data series over time to identify trends, patterns, and performance gaps. Ideal for demonstrating market growth, competitive positioning, revenue trends, and KPI changes across multiple quarters or years.
-
How to Use
Use in quarterly business reviews, investor presentations, market analysis reports, and competitive intelligence briefings. Simply edit the data values and labels directly in PowerPoint to insert your own metrics. The chart automatically updates to reflect your numbers.
-
Recommended For
Marketing managers, business analysts, sales directors, financial planners, management consultants, and executives who need to communicate performance trends and market insights to stakeholders, boards, and teams.
-
Slide Structure
2-slide set. First slide: dark blue background with blue and gold dual lines, 10 data points with numeric labels, vertical grid lines, legend, title, and subtitle areas. Second slide: dark gray background with purple and gold lines, identical 10-point structure. Both slides maintain consistent formatting for seamless presentation flow.
Related Products
-

Wide Graph Presentation with Triangle Pattern
#Market and Competitor Analysis #Marketing Plan and Strategy #Graph
-

Real Estate Construction Status Graph – Market Analysis and Future Forecast
#Market and Competitor Analysis #Graph #Future Outlook
-

Mobile App Competitor Analysis – Visualizing Market Share
#Market and Competitor Analysis #Graph #Other
-

Triangular Pattern Presentation Template – Business Strategy & Market Analysis
#Business Strategy #Market and Competitor Analysis #Graph
