Wide Graph Presentation with Triangle Pattern
RJ0200005_17
- Last Update 03/29/2025
- File Size 0.2MB
- # of Slides 2
- File Format PPTX
- Slide Ratio 16:9
- Color
Keywords
- #Content-Based Slides
- #Design-Based Slides
- #Market and Competitor Analysis
- #Marketing Plan and Strategy
- #Graph
- #Competitive Advantage
- #Target Market Strategy
- #Line
- #Line Chart
- #16:9
- #line chart PowerPoint
- #dual series slide template
- #data visualization presentation
- #marketing analysis chart
- #trend graph PowerPoint template
About the Product
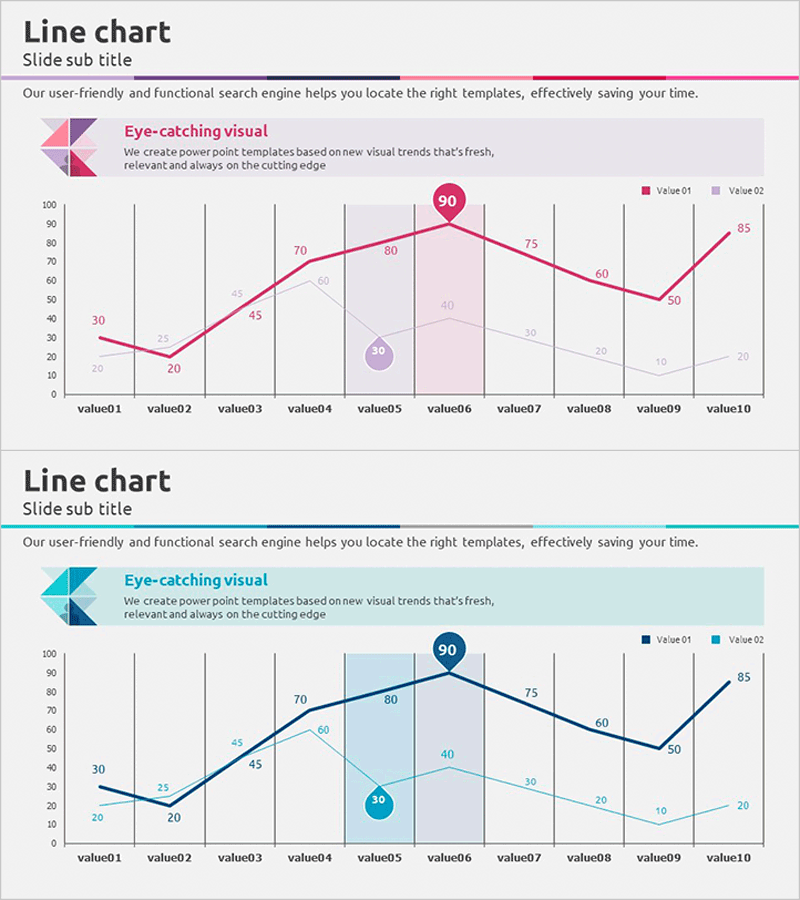
A professional line chart PowerPoint slide optimized for marketing strategy and market analysis presentations. The design features a dual-series data visualization with pink and blue color schemes, clearly distinguishing two data sets across 10 data points with a peak value of 90 highlighted by a circular badge. Vertical bar backgrounds and shaded areas intuitively represent data trends, while a triangle pattern header and icons create a premium presentation structure. The 2-slide set offers multiple color combinations and delivers optimal readability in 16:9 widescreen format for corporate reports and strategic presentations.
Usage Points
-
Main Usage
Visualizes marketing performance, market trends, and competitive analysis over time. The dual-series format simultaneously displays two data sets to reveal correlations and change patterns, while the peak value badge emphasizes key achievements and critical metrics.
-
How to Use
Input time-based numerical data such as sales volume, customer satisfaction scores, or market share percentages to represent trend changes. Maintain the pink and blue color scheme while editing data values, and adjust the peak value badge position as needed to highlight different focal points.
-
Recommended For
Ideal for marketing team quarterly and annual performance reports, sales strategy presentations, and executive business status briefings. Particularly effective in consulting proposals and investor pitch decks where comparing two major performance indicators requires credible data visualization.
-
Slide Structure
Each slide features a triangle pattern header in pink, blue, and purple tones with a title area. The central line chart displays 10 data points across dual series, with vertical bar backgrounds dividing sections and shaded areas representing data ranges. A circular badge highlights the peak value of 90, while legends and icons clarify information hierarchy.
Related Products
-

Visualizing Market Analysis with Line Chart – Securing Competitive Advantage
#Market and Competitor Analysis #Marketing Plan and Strategy #Graph
-

Space Industry Analysis Smooth Line Graph
#Market and Competitor Analysis #Marketing Plan and Strategy #Diagram
-

Orange Hexagon Presentation Template Line Chart
#Market and Competitor Analysis #Graph #Competitor Analysis
-

Real Estate Construction Status Graph – Market Analysis and Future Forecast
#Market and Competitor Analysis #Graph #Future Outlook
