Comparative Analysis Split Bar Graph – Reliable Market Analysis
RB0200004_4
- Last Update 03/08/2025
- File Size 11.2MB
- # of Slides 2
- File Format PPTX
- Slide Ratio 4:3
- Color
Keywords
About the Product
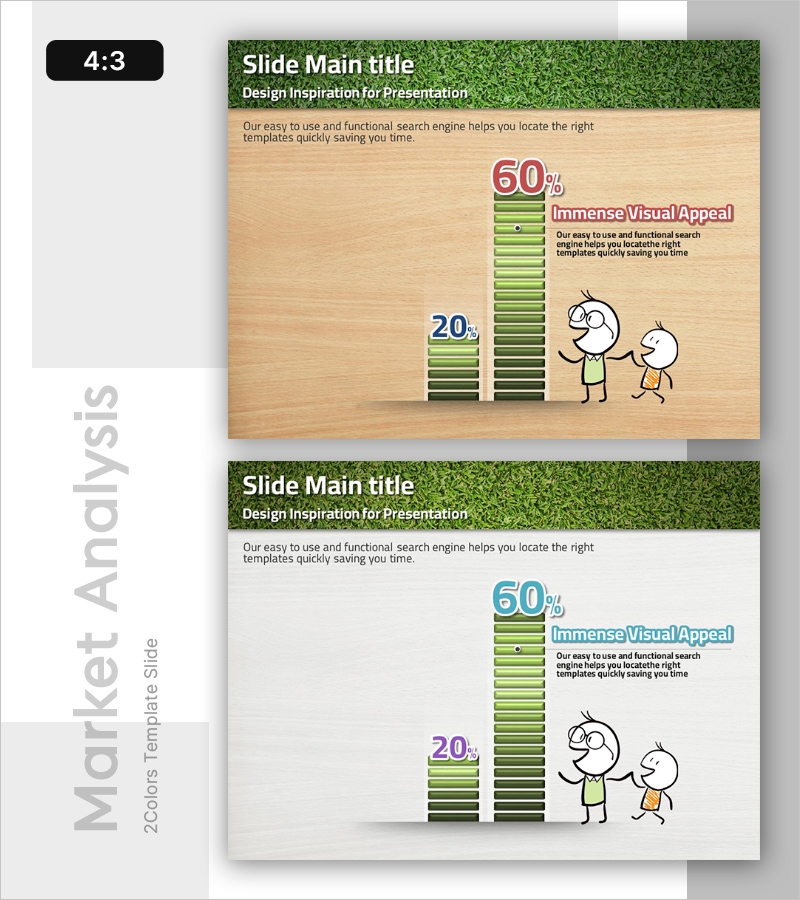
A vertical bar chart PowerPoint slide optimized for market analysis and competitive comparison. Two data series are displayed side-by-side with green gradient coloring, enabling intuitive numerical comparison. Specific percentages like 60% and 20% are highlighted with text boxes and cartoon characters to enhance presentation impact. Available in 4:3 aspect ratio with 2 slides, ready for immediate editing. Perfect for market overview sections in marketing plans, business reports, and proposals.
Usage Points
-
Main Usage
Visualizes two data series side-by-side to compare market share, competitor performance, year-over-year growth rates, and other numerical metrics. Green gradient bars combined with highlighted percentage text clearly communicate key indicators, while cartoon characters create an approachable presentation atmosphere.
-
How to Use
Use in market overview sections of marketing plans, performance comparison pages in business reports, and competitive analysis portions of proposals. Edit bar heights and percentages with your own data, modify legends and titles, and deploy immediately as presentation material.
-
Recommended For
Marketing managers, planners, analysts, and sales executives presenting market analysis, competitive benchmarking, and performance reports. Suitable for data-driven decision-making presentations to executives, investor briefings, and internal strategy meetings.
-
Slide Structure
2-slide set. Slide 1: 60% vs 20% comparative bar chart with green gradient + 'Immense Visual Appeal' text box + cartoon character illustration. Slide 2: identical layout on white background. Each bar features green gradient coloring with percentage labels and descriptive text positioned alongside.
Related Products
-

Comparative Analysis Bar Graph & Table – Optimized for Market and Competitor Analysis
#Market and Competitor Analysis #Diagram #Graph
-

Vertical Bar Graph & Folder Diagram – Market and Competitor Analysis
#Market and Competitor Analysis #Diagram #Graph
-

Competitor and Market Analysis Green Navy Slide
#Market and Competitor Analysis #Graph #Competitor Analysis
-

Market Analysis Circular Bar Graph – Clarity in Information Delivery
#Market and Competitor Analysis #Graph #Competitor Analysis
