Gradient Thermometer Shape Graph – Market and Competitor Analysis
RJ0400054_14
- Last Update 10/27/2025
- File Size 0.1MB
- # of Slides 2
- File Format PPTX
- Slide Ratio 16:9
- Color
Keywords
About the Product
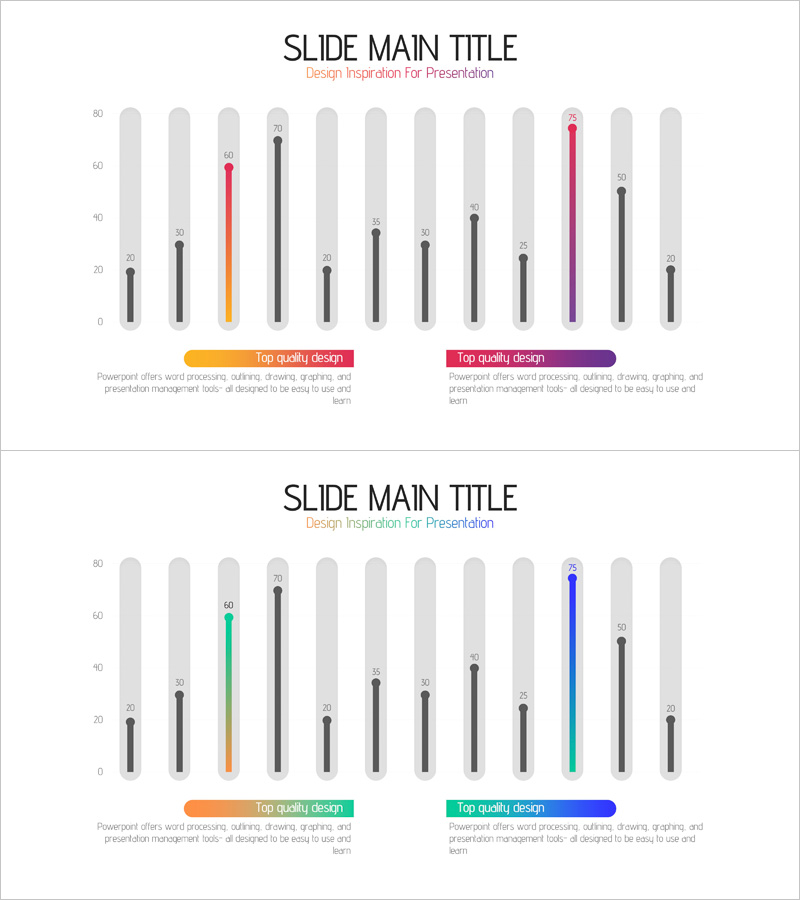
A vertical thermometer-shaped gradient graph PowerPoint slide optimized for market analysis and competitor comparison presentations. The design features a gradient color transition from orange to red and purple, visually representing data intensity and temperature. Two vertical bar structures enable intuitive side-by-side comparison of metrics such as market share, competitive positioning, and performance indicators. The slide deck is fully editable in PPTX format and ready for immediate use in corporate presentations, business reports, and strategic analysis documents.
Usage Points
-
Main Usage
Visualize two-item numerical comparisons in market analysis, competitive benchmarking, and performance evaluation. The gradient color scheme emphasizes data intensity and relative importance, capturing audience attention through temperature-coded visual hierarchy.
-
How to Use
Modify the height and color intensity of the thermometer bars to input your actual data values. Add descriptive labels and legend information to clarify comparison items. Edit the title and subtitle to match your presentation context and messaging.
-
Recommended For
Executive reports, marketing strategy presentations, business analysis documents, investor pitch decks, and consulting proposals. Ideal for professionals including executives, marketing managers, consultants, and data analysts who need quantitative comparative analysis.
-
Slide Structure
2-slide set featuring dual vertical thermometer-shaped bar graphs per slide. Orange-to-red-to-purple gradient coloring applied throughout. Title area at top, legend and descriptive text zones at bottom for clear data annotation.
Related Products
-

Vertical Bar Graph for Market and Competitor Analysis – Professional Data Visuals
#Market and Competitor Analysis #Graph #Competitor Analysis
-

Competitor and Market Analysis Green Navy Slide
#Market and Competitor Analysis #Graph #Competitor Analysis
-

Competitor and Market Analysis Slide Design - Harmony of Blue and Yellow
#Market and Competitor Analysis #Diagram #Graph
-

Pie & Bar Analysis Graphs – Optimized for Market and Competitor Analysis
#Market and Competitor Analysis #Graph #Competitor Analysis
