SEO System Comparison Analysis Bar Graph
RJ0400051_21
- Last Update 05/31/2025
- File Size 4.7MB
- # of Slides 2
- File Format PPTX
- Slide Ratio 16:9
- Color
Keywords
- #Content-Based Slides
- #Design-Based Slides
- #Market and Competitor Analysis
- #Graph
- #Competitor Analysis
- #Market Analysis
- #Column
- #Column Chart
- #16:9
- #horizontal bar chart PowerPoint
- #comparison analysis slide template
- #5-item bar graph
- #competitive analysis presentation
- #market analysis PowerPoint slide
About the Product
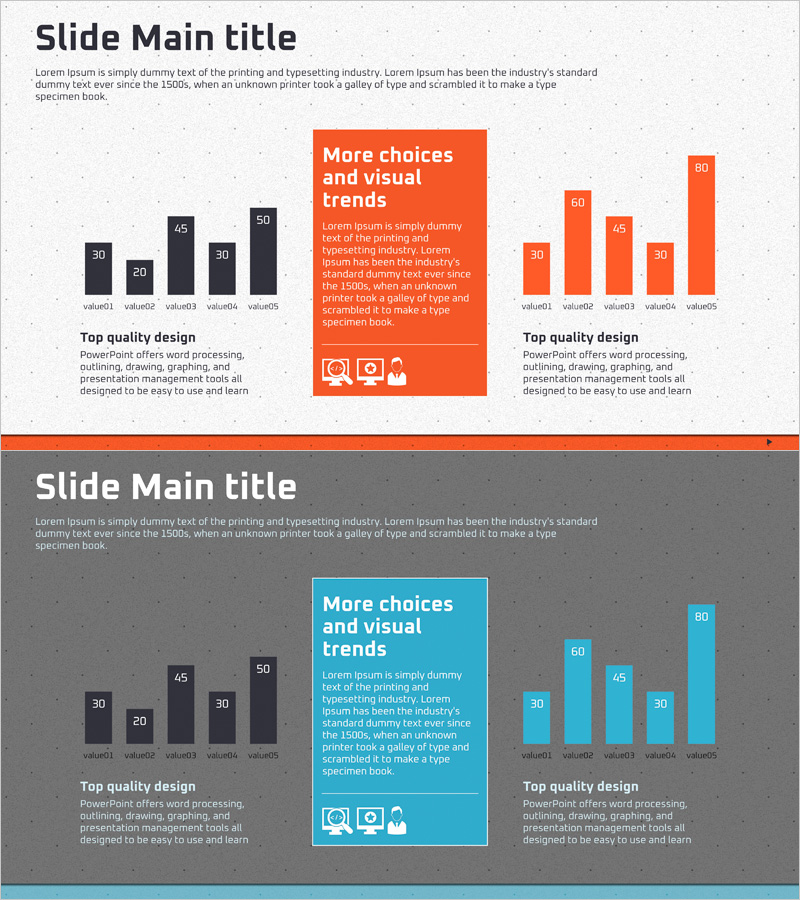
A horizontal bar chart PowerPoint slide designed for SEO system comparison analysis and competitive benchmarking. This presentation template displays five data items side-by-side, making it ideal for competitor performance comparison, market share analysis, technical specification comparison, and other quantitative data visualization. The orange and gray dual-tone color scheme creates clear emphasis and contrast, with numeric labels on each bar for intuitive information delivery. Ready-to-use for business reports, marketing plans, pitch decks, and strategic presentations.
Usage Points
-
Main Usage
Visualizes five data points using horizontal bars to enable direct comparison and analysis. Ideal for competitor performance benchmarking, market share distribution, technical specification comparison, SEO metric analysis, and other quantitative data representation where bar length indicates numerical difference.
-
How to Use
Insert into market analysis, competitive analysis, or performance reporting sections of presentations. Double-click bar values to update with actual data, edit labels and legend to match your analysis context, and customize orange emphasis and gray comparison bar colors as needed for your brand or data hierarchy.
-
Recommended For
Marketing managers, strategy planners, sales executives, management consultants, data analysts, and business intelligence professionals presenting competitive analysis, market research, and performance metrics. Suitable for business plans, investor pitch decks, quarterly reports, marketing strategies, and proposal documents.
-
Slide Structure
Two-slide set featuring horizontal bar chart layouts with five bars per slide. Left side displays item labels (value01–value05), right side shows numeric values. Orange and gray color differentiation emphasizes comparison. Title area at top, descriptive text space at bottom for contextual explanation.
Related Products
-

Big Data Analysis Template Intro
#Market and Competitor Analysis #Graph #Competitor Analysis
-

Market Analysis Round Bar Graph – Effective Tool for Market and Competitor Analysis
#Market and Competitor Analysis #Graph #Competitor Analysis
-

Pie & Bar Analysis Graphs – Optimized for Market and Competitor Analysis
#Market and Competitor Analysis #Graph #Competitor Analysis
-

Comparative Analysis Bar Graph & Table – Optimized for Market and Competitor Analysis
#Market and Competitor Analysis #Diagram #Graph
