Competitor Analysis Comparison Graph – Visualizing Market Shares
RJ0300031_25
- Last Update 04/26/2025
- File Size 0.7MB
- # of Slides 2
- File Format PPTX
- Slide Ratio 16:9
- Color
Keywords
- #Content-Based Slides
- #Design-Based Slides
- #Market and Competitor Analysis
- #Graph
- #Competitor Analysis
- #Market Analysis
- #Column
- #Column Chart
- #16:9
- #horizontal bar chart PowerPoint
- #competitor analysis slide template
- #market share comparison
- #bar graph presentation
- #how to create comparison chart in PowerPoint
About the Product
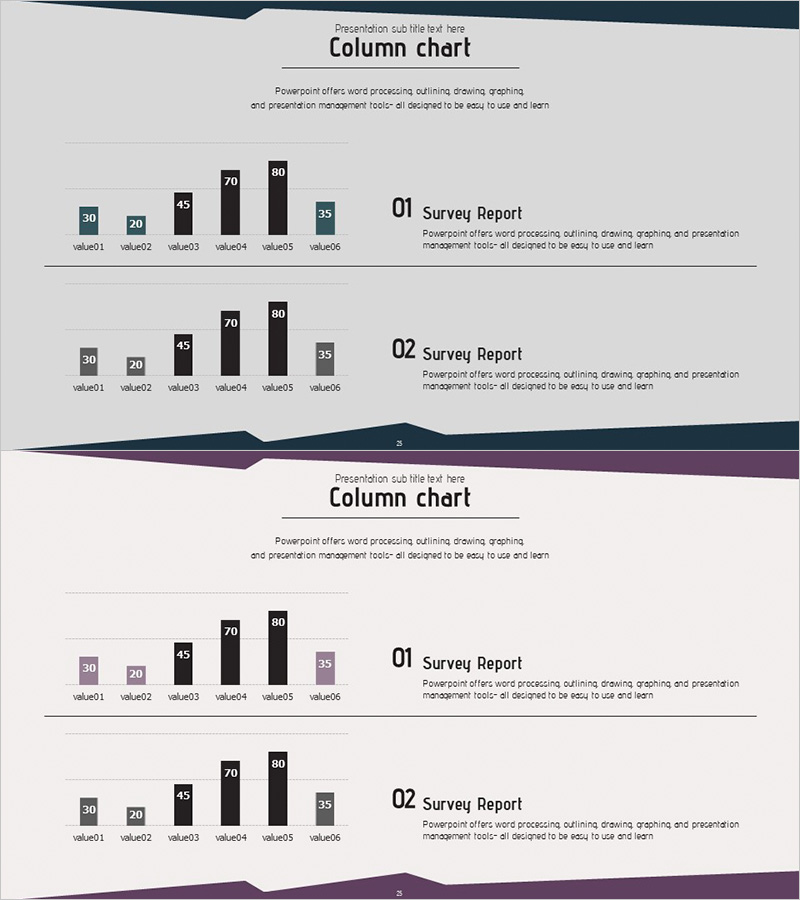
A horizontal bar chart PowerPoint slide optimized for competitor analysis and market share comparison. The design features a professional color palette of dark navy, purple, and gray tones, enabling intuitive comparison of six data values (value01 through value06). The 2-slide template presents the same data in two distinct layouts, allowing flexible selection based on presentation context. Delivered in 16:9 widescreen PPTX format compatible with all PowerPoint versions, with fully editable values and labels for seamless adaptation to various comparative analysis scenarios.
Usage Points
-
Main Usage
Designed to visualize competitor analysis, market share distribution, sales volume, market size, and customer satisfaction metrics through quantitative comparison. The horizontal bar orientation clearly displays numerical differences between items, enhancing data credibility in business reports, strategic presentations, and sales pitches.
-
How to Use
Two slides provided with identical graphs in different layouts: first layout positions the chart on the left with text on the right; second layout places the chart above with text below. Double-click any bar value (30, 20, 45, 70, 80, 35) or label (value01–value06) to edit; the chart updates automatically upon data entry.
-
Recommended For
Marketing managers, sales directors, executive briefings, consulting projects, market research presentations, and quarterly/annual performance analysis. Particularly effective for competitive landscape analysis, customer preference surveys, product performance benchmarking, and data-driven decision-making materials.
-
Slide Structure
2-slide template. Each slide contains a 6-item horizontal bar chart (maximum value 80) with section headers '01 Survey Report' and '02 Survey Report'. Design elements include dark navy header bar, light gray background, purple and gray bar colors, and numeric labels displayed above each bar.
Related Products
-

Vertical Bar Graph for Market and Competitor Analysis – Professional Data Visuals
#Market and Competitor Analysis #Graph #Competitor Analysis
-

Comparative Analysis Split Bar Graph – Reliable Market Analysis
#Market and Competitor Analysis #Graph #Competitor Analysis
-

Business Market Analysis Bar Graph – Visualizing Competitive Analysis
#Market and Competitor Analysis #Diagram #Graph
-

Concise Analysis Column Graph & Table Slide
#Market and Competitor Analysis #Diagram #Graph
