Triangle Pattern PPT Template for Visualizing Market Share with Pie Charts
RJ0200005_6
- Last Update 03/29/2025
- File Size 0.2MB
- # of Slides 2
- File Format PPTX
- Slide Ratio 16:9
- Color
Keywords
About the Product
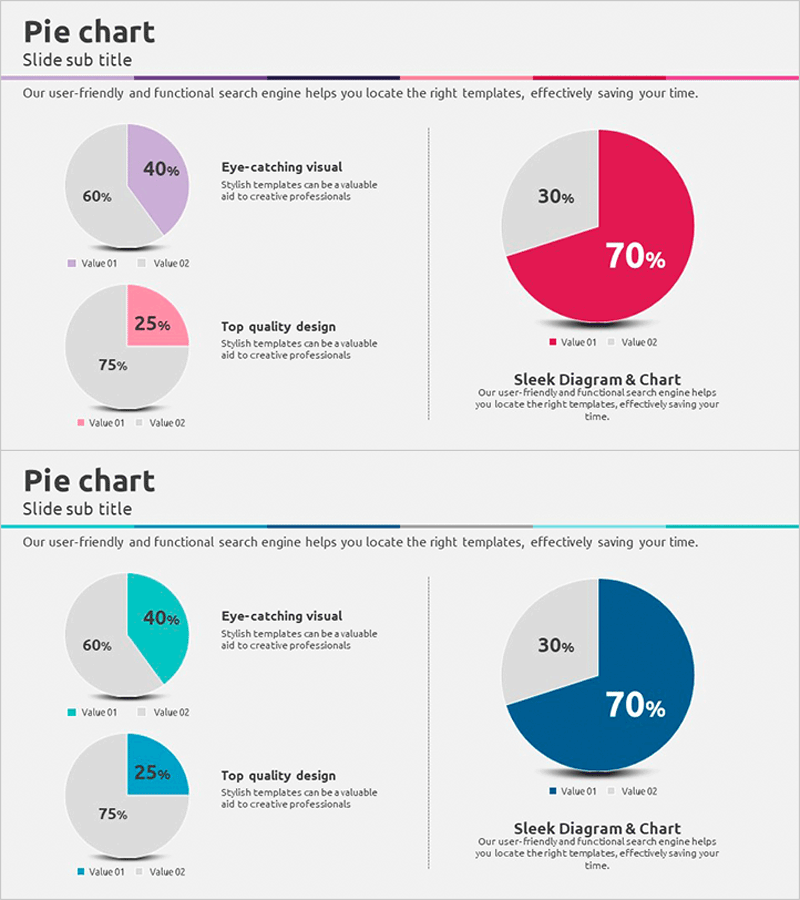
A 2-slide PowerPoint presentation featuring pie charts designed to visualize market share and business performance with clarity and impact. The first slide displays two pie charts with 60%-40% and 75%-25% ratios, allowing side-by-side comparison of multiple metrics. The second slide showcases a large pie chart with 70%-30% split, emphasizing key data points. Color-coded segments in pink, purple, teal, and gray create visual distinction and improve readability. Each chart includes accompanying text areas for context and interpretation. This slide deck is ready to use in business reports, marketing presentations, investor pitches, and strategic planning documents.
Usage Points
-
Main Usage
Effectively communicate two key metrics—such as market share, revenue split, customer segments, or competitive positioning—using proportional pie chart visualization. The color-coded segments and clear labeling enable audiences to instantly grasp relative values and relationships between data categories.
-
How to Use
Use the first slide to compare multiple metrics side-by-side with smaller charts, and the second slide to highlight a single dominant metric with a larger chart. Edit the percentage values, segment labels, and text descriptions to match your actual data. Customize colors if needed to align with your brand guidelines.
-
Recommended For
Marketing managers, sales executives, financial analysts, and business leaders presenting quarterly results, competitive analysis, customer demographics, or revenue breakdowns. Ideal for investor presentations, board meetings, strategic planning sessions, and any data-driven business communication requiring clear ratio visualization.
-
Slide Structure
2 slides total. Slide 1: Two pie charts (60%-40% and 75%-25% ratios) positioned left and center with text explanation area on the right. Slide 2: Large pie chart (70%-30% ratio) on the right with text area on the left. Color palette includes pink, purple, teal, and gray on light background. Optimized for 16:9 widescreen format.
Related Products
-

Pie Chart for Market Share Analysis – Data Visualization
#Market and Competitor Analysis #Graph #Market Status
-

Agricultural Equipment Investment Plan Pie Chart
#Market and Competitor Analysis #Graph #Market Status
-

Market Targets and Status Chart – Visually Appealing Insights
#Market and Competitor Analysis #Graph #Market Status
-

Travel Survey Results – Market Share Visualization
#Market and Competitor Analysis #Graph #Market Status
