3D Pie Chart Analysis (Green & Blue) – Market Share Visualization
RB0800017_10
- Last Update 03/21/2025
- File Size 1.7MB
- # of Slides 2
- File Format PPTX
- Slide Ratio 4:3
- Color
Keywords
About the Product
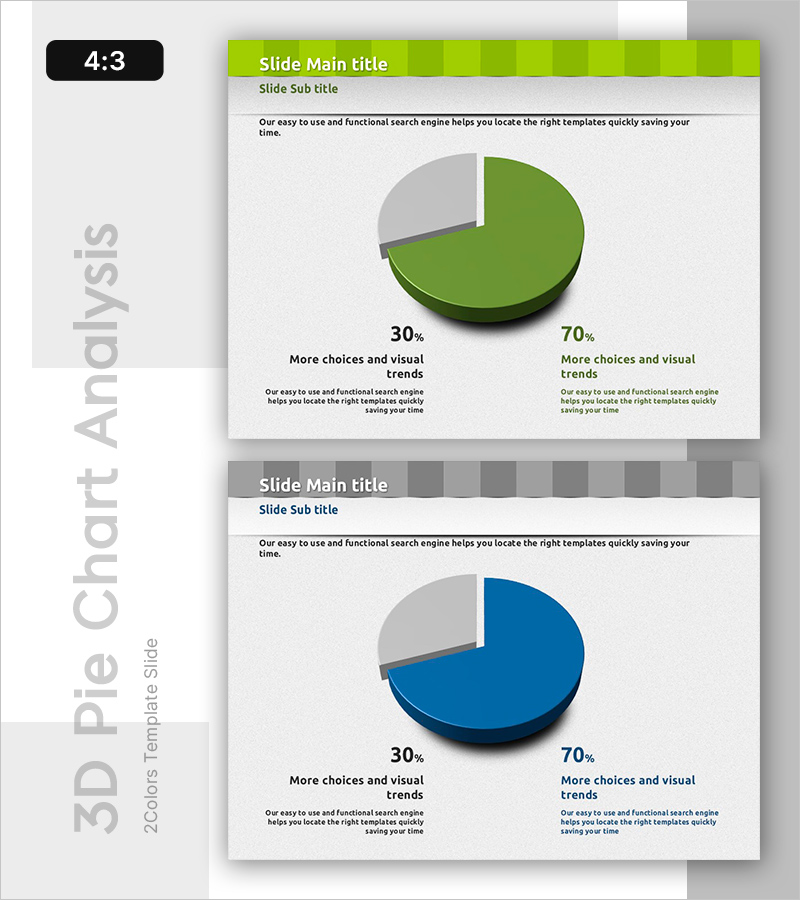
A 3D pie chart PowerPoint slide designed for market share and competitive analysis presentations. The two-segment design uses contrasting green and blue tones to clearly distinguish between two data sets, with percentage labels and descriptive text positioned below each section for enhanced information clarity. This 4:3 aspect ratio, 2-slide template is ready for immediate use in market analysis presentations. The 3D effect provides visual impact while maintaining data readability and professional appearance.
Usage Points
-
Main Usage
Ideal for presenting two primary data sets side-by-side, such as market share distribution, competitive positioning, or customer preference analysis. The 3D pie chart design emphasizes key metrics while percentage labels and supporting text ensure clear data communication and presentation impact.
-
How to Use
Integrate into business reports, marketing presentations, and investor pitch decks within market analysis sections. Edit the percentage values and segment labels with your actual data for immediate presentation use. Colors can be customized to match corporate branding guidelines.
-
Recommended For
Marketing professionals, business strategists, executive report writers, market research analysts, and sales presenters who need to communicate competitive landscape analysis and market positioning effectively.
-
Slide Structure
Two-slide template featuring 3D pie charts with 2-segment division on each slide. Layout includes title and subtitle at top, centered 3D pie chart in green and blue tones, and percentage labels (30% and 70%) with descriptive text below each segment for comparative data analysis.
Related Products
-

Pie Chart for Market Share Analysis – Data Visualization
#Market and Competitor Analysis #Graph #Market Status
-

Pie Chart for Oriental Medicines Market Overview
#Market and Competitor Analysis #Graph #Market Status
-

Triangle Pattern PPT Template for Visualizing Market Share with Pie Charts
#Market and Competitor Analysis #Graph #Market Status
-

Agricultural Equipment Investment Plan Pie Chart
#Market and Competitor Analysis #Graph #Market Status
