Pie Chart for Market Share Analysis – Data Visualization
RB0800003_13
- Last Update 03/17/2025
- File Size 0.1MB
- # of Slides 2
- File Format PPTX
- Slide Ratio 4:3
- Color
Keywords
- #Content-Based Slides
- #Design-Based Slides
- #Market and Competitor Analysis
- #Graph
- #Market Status
- #Market Share
- #Circles
- #Pie Chart
- #4:3
- #pie chart PowerPoint slide
- #circular chart template
- #market share analysis
- #data visualization slide
- #3-segment pie graph
- #competitive analysis chart
- #PowerPoint pie chart download
About the Product
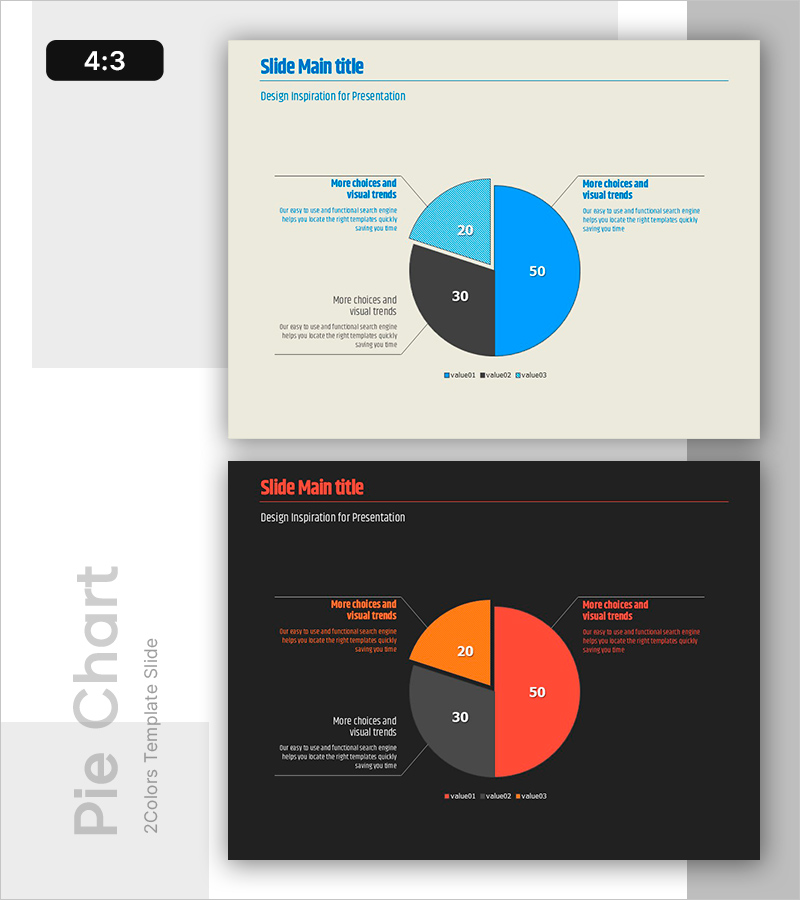
A three-segment pie chart PowerPoint slide designed to visualize market share, competitive analysis, and customer composition data with clarity and impact. The slide features a light beige background with three distinct color segments (blue, black, and orange) and accompanying text boxes positioned on the left and right sides for detailed explanations. This 4:3 ratio, 2-slide template is ready to use in business presentations, marketing analysis reports, and strategic briefings. All data values and colors are fully editable, allowing you to customize the chart to match your specific dataset and branding requirements.
Usage Points
-
Main Usage
Effectively communicate market share distribution, competitor market positions, customer segmentation, revenue composition, and product sales breakdown. Ideal for any business scenario requiring clear visualization of parts relative to a whole across three categories.
-
How to Use
Double-click each pie segment to update the numerical values with your actual data. Edit the legend and accompanying text boxes to add detailed descriptions for each segment. Customize colors if needed to match your corporate branding.
-
Recommended For
Marketing professionals presenting market analysis reports, sales teams comparing competitive positions, executive briefings, business plan market overview sections, and quarterly performance analysis presentations.
-
Slide Structure
Three-segment pie chart (blue 50%, black 30%, orange 20%) with three accompanying text boxes positioned at top-left, top-right, and bottom-left. Includes legend. Provided in 4:3 aspect ratio across 2 slides.
Related Products
-

3D Pie Chart Analysis (Green & Blue) – Market Share Visualization
#Market and Competitor Analysis #Graph #Market Status
-

Two Pie Charts with Commentary – Market Share Analysis
#Market and Competitor Analysis #Graph #Market Status
-

Triangle Pattern PPT Template for Visualizing Market Share with Pie Charts
#Market and Competitor Analysis #Graph #Market Status
-

Pie Chart for Oriental Medicines Market Overview
#Market and Competitor Analysis #Graph #Market Status
