Identity Presentation Wide Template – Competitor Analysis Table
RJ0200003_9
- Last Update 03/29/2025
- File Size 0.3MB
- # of Slides 2
- File Format PPTX
- Slide Ratio 16:9
- Color
Keywords
- #Content-Based Slides
- #Design-Based Slides
- #Market and Competitor Analysis
- #Financial Plans and Performance
- #Diagram
- #Competitor Analysis
- #Balance Sheet
- #Table
- #Standard Table
- #16:9
- #competitor analysis table PowerPoint
- #comparison table slide template
- #data comparison PPT slide
- #table diagram PowerPoint template
- #two-column comparison slide
About the Product
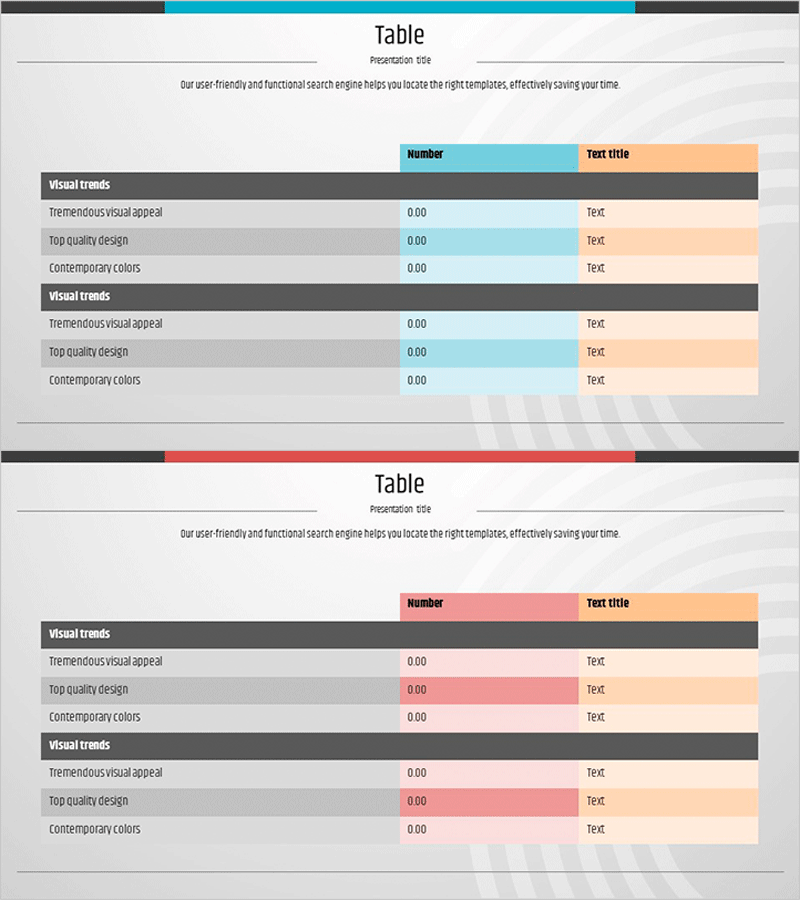
A table-based PowerPoint slide designed for competitor analysis and market comparison presentations. The left side features a gray header section for item labels, while the right side displays a two-column structure in cyan and orange for data entry and text. The color-coded layout creates visual hierarchy and ensures clear information delivery. Ideal for business presentations covering competitive landscape analysis, product feature comparison, performance metrics, and market positioning. Provided in 16:9 widescreen format with 2 slides in PPTX.
Usage Points
-
Main Usage
Present side-by-side comparisons of competitors, product features, performance metrics, and market data. The two-column structure enables clear visual contrast and helps audiences quickly grasp competitive advantages and differentiation points.
-
How to Use
Enter comparison item names (competitor names, product names, metrics) in the left gray header area. Input corresponding data and descriptions in the right cyan and orange columns. The color distinction automatically emphasizes the comparison and draws audience attention.
-
Recommended For
Marketing professionals, strategy planners, sales presentations, executive reports, investor pitch decks, product launch announcements, market analysis reports, and any business presentation requiring quantitative comparison and competitive positioning.
-
Slide Structure
2-slide set. Each slide contains a left gray header section (3-4 item entry areas) and a right two-column data area in cyan and orange. Rows can be added or color-modified to accommodate additional comparison items.
Related Products
-

Logistics Data by Year Pie Chart – Strategy for Competitor Analysis
#Market and Competitor Analysis #Diagram #Graph
-

Green Brown Statistics Table – Financial Performance Analysis
#Financial Plans and Performance #Diagram #Balance Sheet
-

Market Trend Analysis Mixed Graph & Table
#Market and Competitor Analysis #Diagram #Graph
-

Comparative Analysis Bar Graph & Table – Optimized for Market and Competitor Analysis
#Market and Competitor Analysis #Diagram #Graph
