Competitor Analysis by Year Bundled Graph – Market Trend Insights
RM0400012_6
- Last Update 02/18/2025
- File Size 1MB
- # of Slides 2
- File Format PPTX
- Slide Ratio 16:9
- Color
Keywords
- #Content-Based Slides
- #Design-Based Slides
- #Market and Competitor Analysis
- #Diagram
- #Graph
- #Competitor Analysis
- #Industry Trends
- #Table
- #Column
- #Standard Table
- #Grouped Column
- #16:9
- #bundled bar chart PowerPoint
- #competitor analysis slide
- #market trend chart
- #year-over-year comparison template
- #multi-series graph PowerPoint
- #data visualization slide template
About the Product
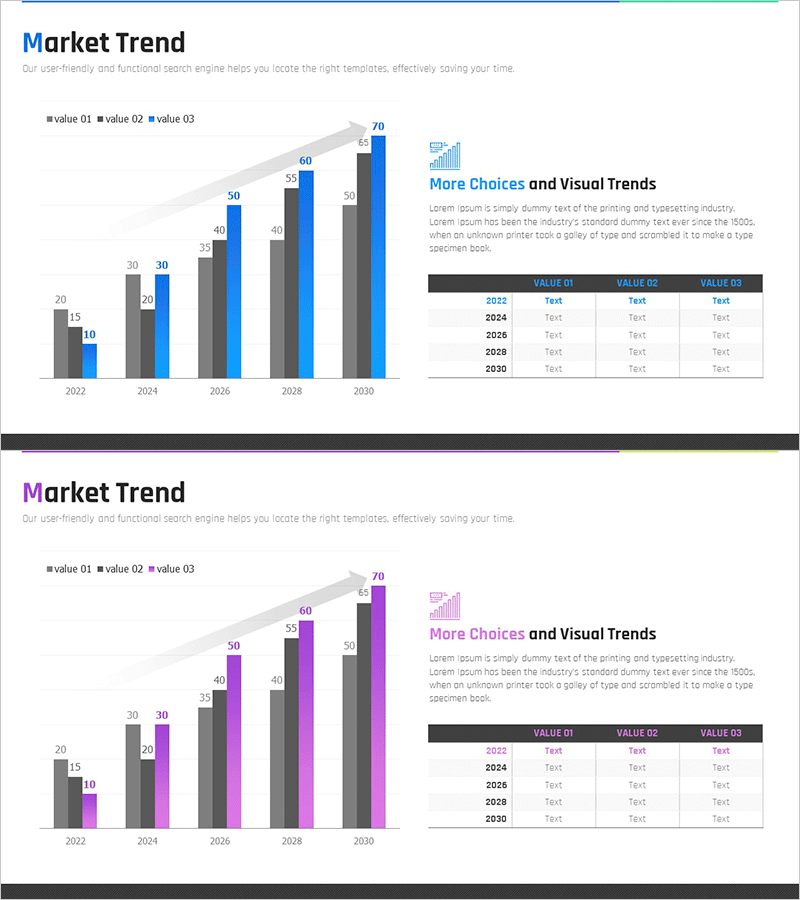
A 2-slide PowerPoint template featuring bundled bar charts for year-over-year competitor analysis. Displays data from 2022 to 2030 across three series (value 01, 02, 03) in both horizontal and vertical bar formats, enabling clear comparison of market trends and competitive positioning. Color-coded in gray, blue, and purple tones for distinct series differentiation, with a data table on the right side for supplementary numerical information. Ready-to-use for presentations, reports, and analytical documents requiring competitive benchmarking visualization.
Usage Points
-
Main Usage
Visualize and compare year-over-year competitor performance across three data series simultaneously, enabling clear market trend analysis and competitive positioning assessment. Dual horizontal and vertical bar formats allow flexible data representation, with an integrated data table for concurrent numerical display.
-
How to Use
Deploy in executive reports, business analysis presentations, marketing strategy meetings, and investor pitch decks as the competitive analysis section. Slide 1 features horizontal bundled bars while Slide 2 presents vertical bundled bars, allowing format selection based on document layout and presentation flow requirements.
-
Recommended For
Strategy planners, marketing teams, executives, consultants, business analysts, and BD professionals conducting competitive analysis, market reporting, and performance benchmarking. Applicable across finance, IT, manufacturing, retail, and other industries requiring competitive intelligence visualization.
-
Slide Structure
Slide 1: Horizontal bundled bar chart (2022–2030, 3 series, value labels) + right-aligned data table (VALUE 01/02/03 columns, year rows). Slide 2: Vertical bundled bar chart (same data, rotated axis) + matching data table. Gray, blue, and purple color-coded series with legend included.
Related Products
-

Performance Analysis Table Slide – Market and Competitor Analysis
#Market and Competitor Analysis #Diagram #Graph
-

Comparison Chart of Pet Expenditure – Essential Template for Competitor Analysis
#Market and Competitor Analysis #Diagram #Graph
-

Market Trend Analysis Graph & Table Chart
#Market and Competitor Analysis #Diagram #Graph
-

Competitor Comparison Analysis Graph - A Tool for Effective Market Analysis
#Market and Competitor Analysis #Diagram #Graph
