Visualizing Company Sales with Vertical Bar Chart – Sharing Trust and Success
RJ0200003_6
- Last Update 03/29/2025
- File Size 0.3MB
- # of Slides 2
- File Format PPTX
- Slide Ratio 16:9
- Color
Keywords
About the Product
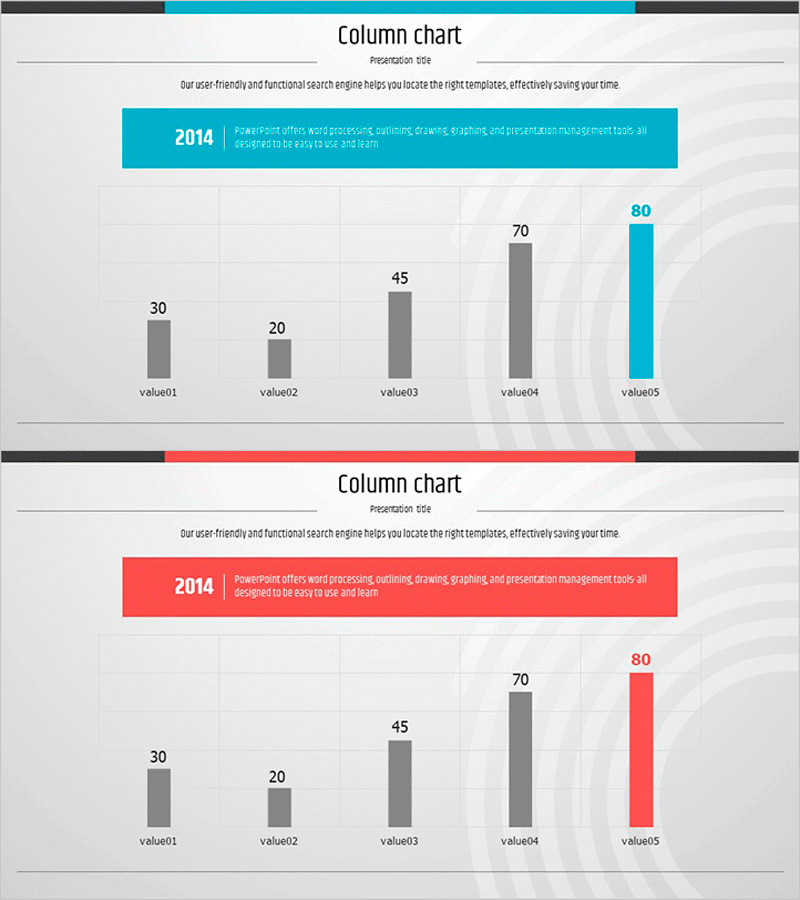
A vertical bar chart PowerPoint slide designed to visualize company sales data across five items. The two-slide set features a dual-tone color scheme with gray and blue on the first slide, and gray and red on the second, allowing flexible presentation options. Each bar displays numerical values at the top for precise data communication. The 16:9 widescreen PPTX format enables quick editing—simply replace value01 through value05 with your actual sales figures. Ideal for quarterly reports, performance reviews, and investor presentations.
Usage Points
-
Main Usage
Compares quarterly, annual, or departmental sales figures using a vertical bar chart. The height difference between bars instantly shows performance gaps, while numerical labels above each bar ensure precise data interpretation and support data-driven decision-making.
-
How to Use
Use in business reports, quarterly earnings presentations, investor briefings, and management meetings. Replace the placeholder values (value01–value05) and numbers with your actual sales data. Colors and fonts are fully editable to match your corporate branding.
-
Recommended For
Finance teams, sales departments, executives, and investors. Suitable for quarterly performance sharing, earnings calls, board meetings, and marketing ROI analysis. Works well for organizations requiring numerical evidence in strategic discussions.
-
Slide Structure
Two-slide set. Each slide contains an information box at the top (2014 label with descriptive text) and a chart area below. The chart displays five vertical bars (value01=30, value02=20, value03=45, value04=70, value05=80). The first slide highlights the final bar in blue; the second highlights it in red for visual variety.
Related Products
-

Global Regional Analysis Vertical Bar Graph - Insights from Regional Data
#Company Introduction #Market and Competitor Analysis #Graph
-

Visualizing Successful Business Performance with Horizontal Bar Chart
#Company Introduction #Business Strategy #Graph
-

Global Market Analysis Map – Importance of Market Connectivity
#Company Introduction #Market and Competitor Analysis #Graph
-

Check Pattern Template for Subject Performance Visualization
#Company Introduction #Product/Service Introduction #Graph
