Global Regional Analysis Vertical Bar Graph - Insights from Regional Data
RJ0300072_13
- Last Update 05/08/2025
- File Size 0.6MB
- # of Slides 2
- File Format PPTX
- Slide Ratio 16:9
- Color
Keywords
- #Content-Based Slides
- #Design-Based Slides
- #Company Introduction
- #Market and Competitor Analysis
- #Graph
- #Other
- #Global Network
- #Target Market
- #Column
- #Column Chart
- #Map
- #16:9
- #world map PowerPoint slide
- #regional bar chart template
- #global data visualization
- #geographic comparison chart
- #international market analysis slide
About the Product
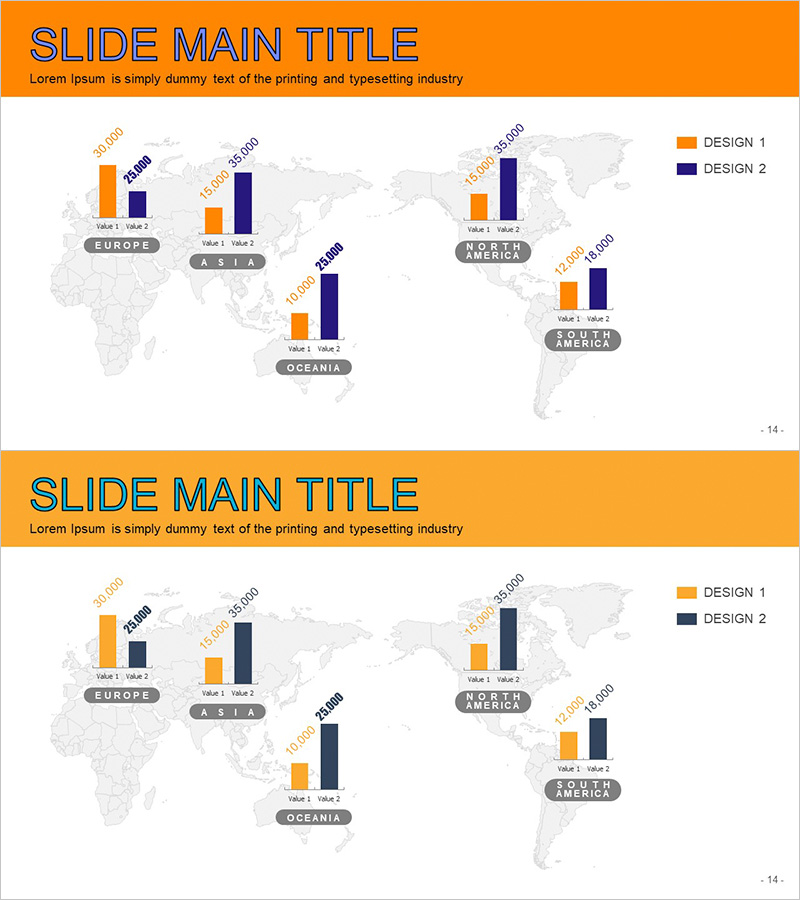
A world map-based bar chart PowerPoint slide designed for global market analysis and regional performance comparison. This presentation template displays five regions—Europe, Asia, North America, South America, and Oceania—with dual-series bar charts in orange (Design 1) and navy blue (Design 2) to enable intuitive cross-regional data visualization. Each region includes clear labels and numerical values, formatted in 16:9 widescreen ratio across 2 slides for seamless integration into your presentation flow. Instantly applicable for visualizing regional revenue, customer counts, market share, growth rates, and other geographic performance metrics.
Usage Points
-
Main Usage
This data visualization slide communicates global market status, regional performance, and international comparisons at a glance. By overlaying bar charts on a world map background, it simultaneously displays geographic location and numerical data, making it ideal for international business reports, market entry strategies, and global performance analysis presentations.
-
How to Use
Simply replace the numerical values beneath each region label with your actual data. The dual-series design (orange and navy) supports year-over-year, product-by-product, or department-by-department comparisons. You can easily add or remove regions, adjust colors, or modify the layout as needed. The 16:9 format ensures compatibility with modern projectors and displays, and the 2-slide structure adapts to various presentation scenarios.
-
Recommended For
Ideal for executives, marketing teams, and sales professionals at multinational corporations presenting international market status. Particularly effective for consulting, finance, manufacturing, and distribution organizations analyzing regional performance, market share, and customer distribution. Also suitable for academic presentations and international conferences requiring clear global data communication.
-
Slide Structure
2-slide set featuring a world map background with 5 labeled regions (Europe, Asia, North America, South America, Oceania). Each region displays dual-series bar charts in orange and navy blue, with region names and numerical data clearly marked. A legend distinguishes Design 1 and Design 2 series, facilitating comparative analysis across all geographic areas.
Related Products
-

Country-by-Country Bar Chart Analysis – Market Trend Insights
#Company Introduction #Market and Competitor Analysis #Graph
-

Target Market Analysis World Map & Bar Graph
#Company Introduction #Market and Competitor Analysis #Graph
-

Target Country Analysis Graph – Understanding Global Markets
#Company Introduction #Graph #Other
-

Global Target Country Map – Essential Tool for Market Analysis
#Company Introduction #Market and Competitor Analysis #Other
