Check Pattern Template for Subject Performance Visualization
RJ0500029_6
- Last Update 06/15/2025
- File Size 0.3MB
- # of Slides 2
- File Format PPTX
- Slide Ratio 16:9
- Color
Keywords
- #Content-Based Slides
- #Design-Based Slides
- #Company Introduction
- #Product/Service Introduction
- #Graph
- #Key Achievements
- #Development Status
- #Column
- #Column Chart
- #16:9
- #vertical bar chart PowerPoint
- #infographic slide template
- #performance comparison chart
- #check pattern design
- #multi-series data visualization
About the Product
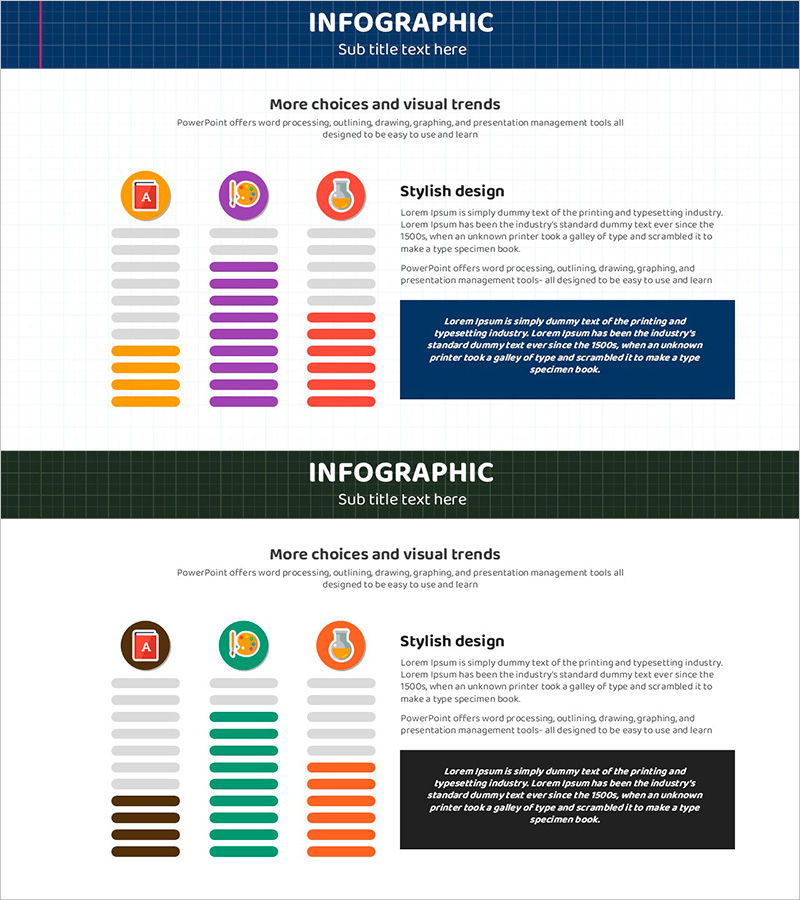
A colorful vertical bar chart infographic PowerPoint slide combining a check pattern background with multi-colored bars for data visualization. This 2-slide template features orange, purple, and gray bar series to compare performance across subjects, departments, or categories at a glance. Ideal for educational institutions, performance reports, and analytical presentations. The 16:9 widescreen PPTX format is compatible with all PowerPoint versions and fully editable for custom data input.
Usage Points
-
Main Usage
Visualize student performance metrics in educational settings, compare departmental or product sales figures in corporate environments, present multi-series research data in academic conferences, and illustrate key performance indicators in analytical reports. The check pattern background draws visual attention while maintaining data clarity.
-
How to Use
Open the slide and adjust bar heights and colors to match your data. Edit the title, legend, and descriptive text fields. Maintain the orange, purple, and gray color scheme or customize with your organization's brand colors. The 16:9 aspect ratio optimizes display on projectors and screen-sharing platforms.
-
Recommended For
Education boards and schools presenting student achievement analysis, corporate executives reviewing departmental performance, marketing teams analyzing product sales trends, academic researchers presenting comparative study results, and government agencies reporting policy impact metrics.
-
Slide Structure
2-slide template with header section (check pattern background + title area), central graph zone (3–5 vertical bars in orange, purple, and gray series), and footer area for legend and descriptive text. Bar heights represent numerical values; icons and text labels can be added for enhanced clarity.
Related Products
-

Triangular Pattern Column Chart – Visualizing Key Achievements
#Company Introduction #Product/Service Introduction #Graph
-

Little Witch and Donut Chart – Visualizing Achievements in Presentation Slide
#Company Introduction #Product/Service Introduction #Graph
-

Four Color Infographic Template for Data Visualization Using Pie Charts
#Company Introduction #Product/Service Introduction #Graph
-

Doughnut Chart for Visualizing Key Achievements – Quality Presentation
#Company Introduction #Product/Service Introduction #Graph
