Revenue Mix Portfolio Slide – 3-Segment Dark Red & Purple
RBTK0200001_8
- Last Update 05/06/2026
- File Size 15.3MB
- # of Slides 2
- File Format PPTX
- Slide Ratio 16:9
- Color
Keywords
- #Design-Based Slides
- #Company Introduction
- #Graph
- #Key Achievements
- #Circles
- #Doughnut Chart
- #16:9
- #business portfolio revenue mix PowerPoint slide
- #segment growth analysis presentation template
- #revenue mix donut chart slide deck dark theme
- #board presentation portfolio analysis PowerPoint
- #three-segment business portfolio presentation slide
About the Product
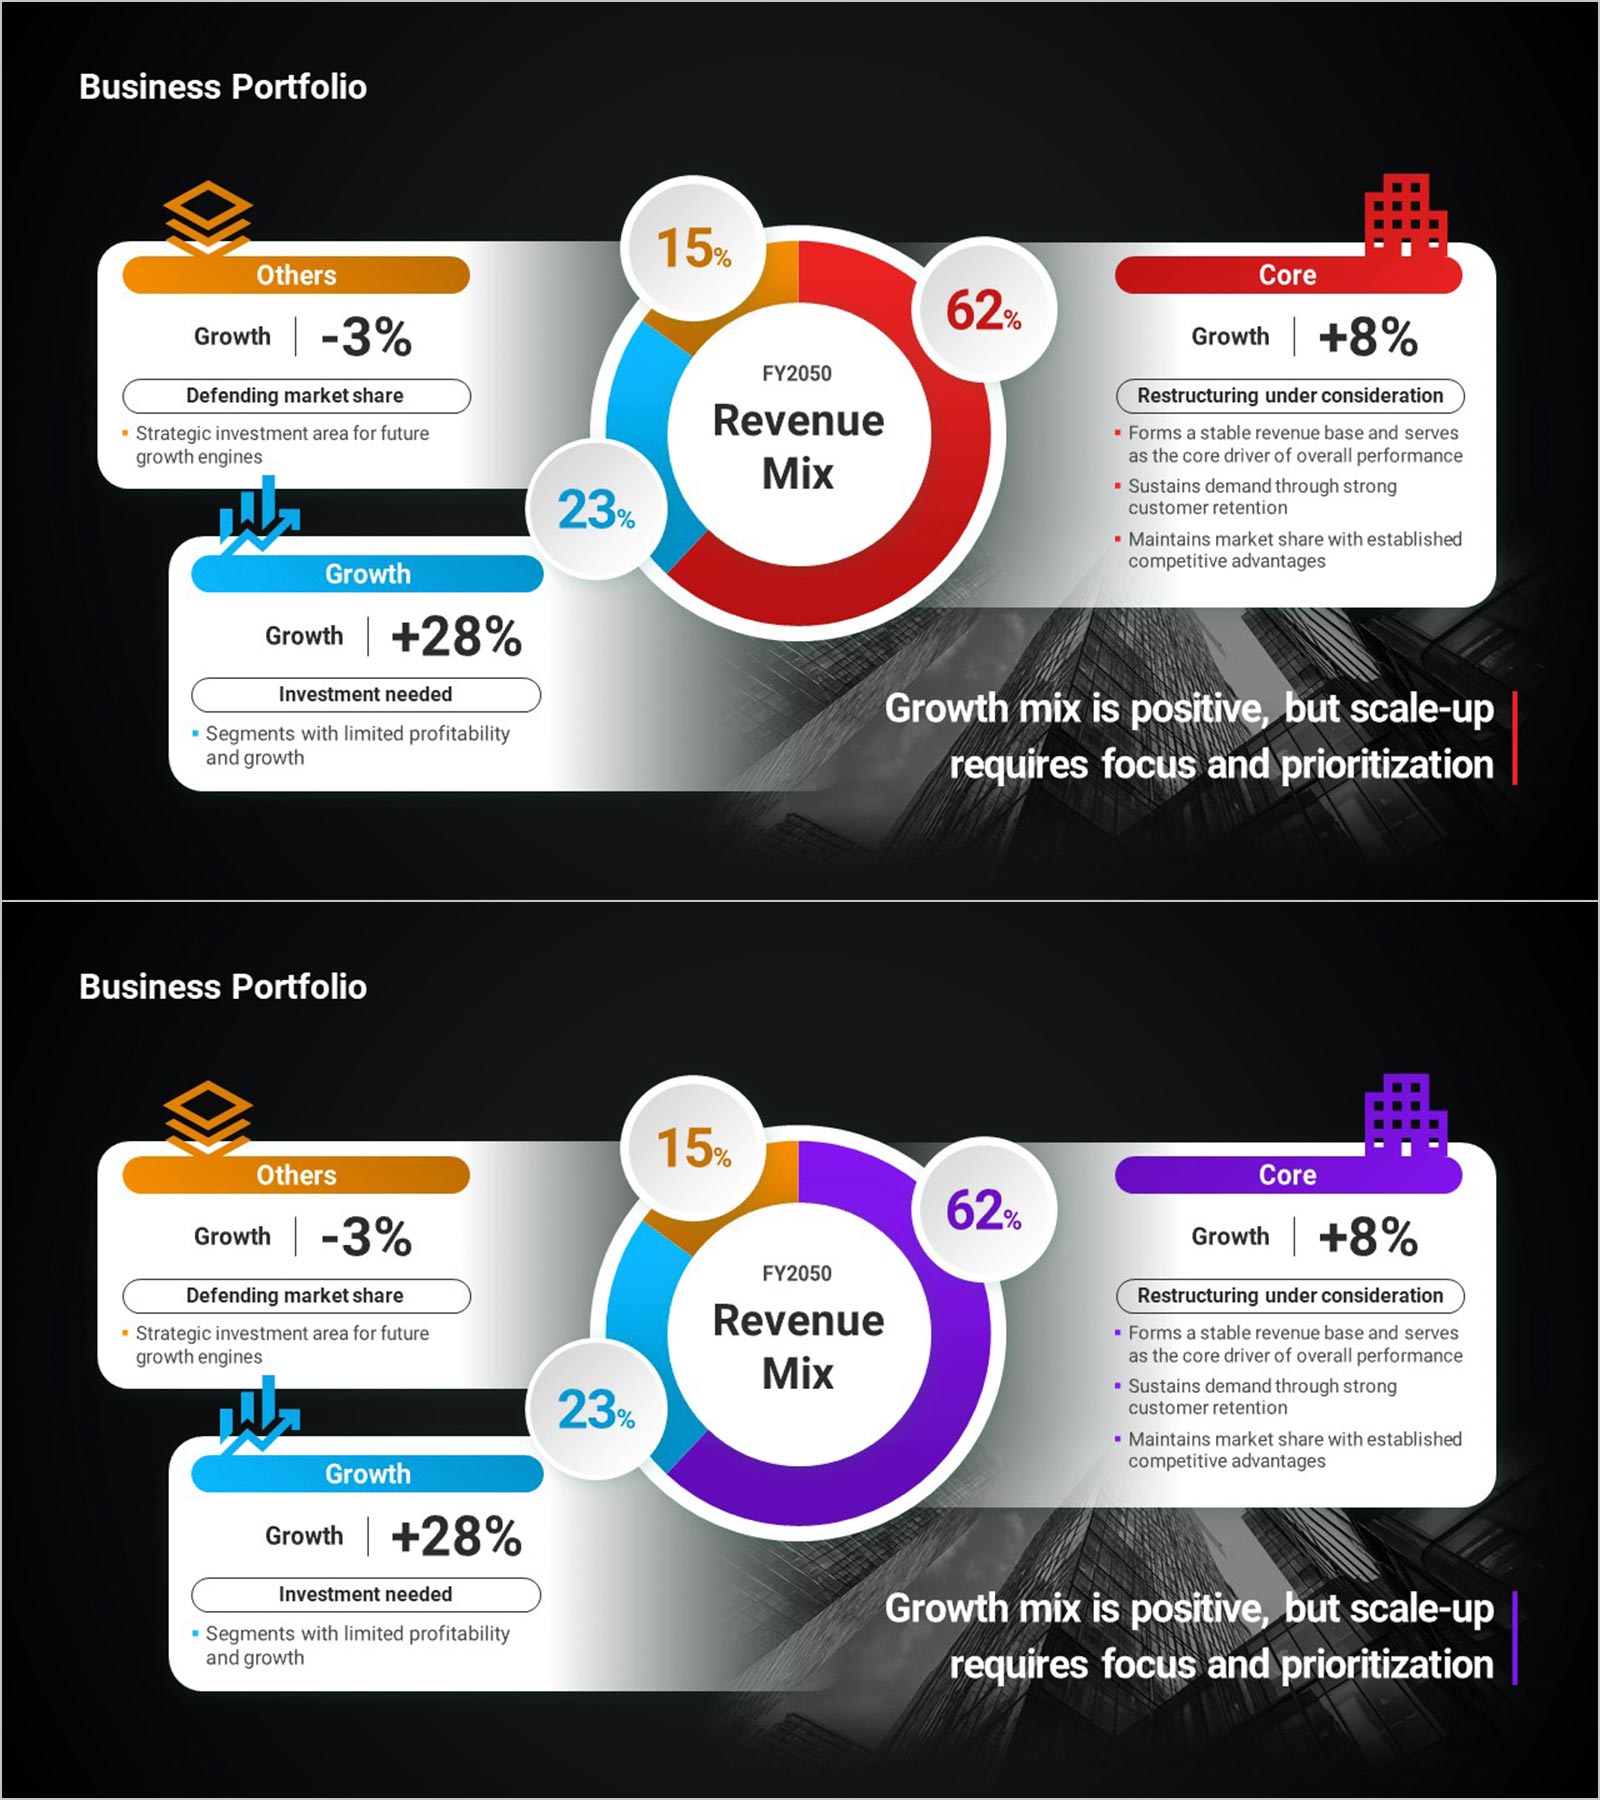
Business portfolio revenue mix PowerPoint slide with a center donut chart and three segment cards. The donut chart shows FY2050 revenue mix with bubble labels: Core 62%, Growth 23%, and Others 15%. Three surrounding segment cards present: Core (red or purple header, +8% growth, "Restructuring under consideration," with three strategic bullet points), Others (orange header, -3% growth, "Defending market share," strategic investment area note), and Growth (blue header, +28% growth, "Investment needed," limited profitability note). A bottom-right insight statement reads "Growth mix is positive, but scale-up requires focus and prioritization." Dark background in red-accent and purple-accent variants. Editable in PowerPoint for corporate board presentations, business performance reports, and IR pitch decks.
Usage Points
-
Main Usage
Use as the business portfolio section in corporate board presentations and IR pitch decks. Presents revenue mix ratios and segment growth strategies in one PowerPoint slide.
-
How to Use
Replace the donut chart segment percentages and three card headers, growth rates, strategic labels, and bullet points with your business portfolio data in PowerPoint.
-
Recommended For
Ideal for corporate CFOs, strategy planners, and IR managers presenting business portfolio revenue mix and segment-level growth strategies to investors and board members.
-
Slide Structure
One slide. Title. Center: donut chart with segment bubbles. Surrounding: three segment cards with growth rates and labels. Bottom-right insight. Dark red and purple versions.
Related Products
-

Market Sales by Tea Type – Highlighting Key Performance
#Company Introduction #Financial Plans and Performance #Graph
-

Achievement Rate Donut Chart – A Visual Tool for Business Performance
#Company Introduction #Business Strategy #Graph
-

Simple & Modern PPT Slide with Donut Chart
#Company Introduction #Business Introduction #Graph
-

Hologram Donut Chart PPT for Visualizing Key Achievements
#Company Introduction #Product/Service Introduction #Graph
