Subdivision Vertical Graph Comparison Type – Optimal for Business Strategy Analysis
RJ0500005_12
- Last Update 08/27/2025
- File Size 1MB
- # of Slides 2
- File Format PPTX
- Slide Ratio 16:9
- Color
Keywords
- #Content-Based Slides
- #Design-Based Slides
- #Business Strategy
- #Market and Competitor Analysis
- #Graph
- #Achievements
- #Future Outlook
- #Column
- #Segmented Column
- #16:9
- #subdivision vertical bar chart PowerPoint
- #stacked column chart slide
- #multi-series comparison graph
- #business analysis chart
- #PowerPoint graph slide template
About the Product
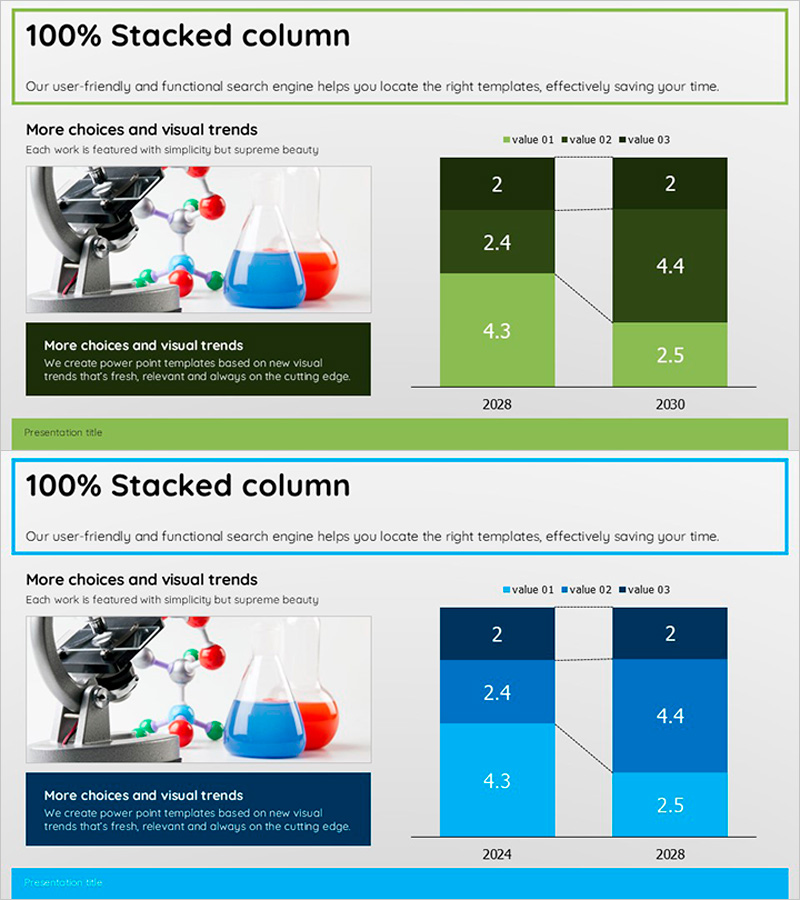
A PowerPoint slide featuring a subdivision vertical bar chart comparing three data series across two years (2028 and 2030). The design uses a green gradient color scheme to clearly distinguish data layers, with numerical labels displayed on each segment for precise analysis. This presentation slide is ready to use for business strategy presentations, competitive market analysis, performance comparisons, and other analytical scenarios. Provided in 16:9 aspect ratio, 2-slide format, PPTX file type.
Usage Points
-
Main Usage
This slide enables side-by-side comparison and analysis of multiple data series such as year-over-year, departmental, or product-level metrics. The subdivision structure clearly shows numerical differences between series, making it ideal for business performance reviews, market share analysis, competitive benchmarking, and presentations requiring quantitative evidence.
-
How to Use
Simply edit the numerical values in each bar segment with your own data for immediate use. Replace the year labels (2028 and 2030) with your target periods, and update the value labels (value 01, 02, 03) with your actual metrics (revenue, customer count, market share, etc.). Colors can also be adjusted to match your corporate brand guidelines.
-
Recommended For
Ideal for executives, marketing teams, sales teams, and strategic planning departments presenting quarterly or annual performance reports, business plans, and competitive analysis. Particularly effective for multi-year trend comparisons, departmental performance benchmarking, product line sales analysis, and any scenario requiring complex data visualization.
-
Slide Structure
2-slide format with each slide displaying 2 years (2028 and 2030) on the horizontal axis and 3 data series (value 01, 02, 03) represented as stacked vertical bars. A 3-step green gradient distinguishes each series, with numerical labels (2, 2.4, 4.3, 4.4, 2.5, etc.) on each segment enabling precise data interpretation.
Related Products
-

Segmented Vertical Bar Graph Identity Wide Template – Analysis and Vision Presentation
#Business Strategy #Market and Competitor Analysis #Graph
-

Market Growth Chart for Business Insights
#Market and Competitor Analysis #Diagram #Graph
-

Segmentation Analysis Graph – Business Strategy and Future Outlook
#Business Vision and Strategy #Market and Competitor Analysis #Graph
-

Graph Analyzing Lung Cancer Treatment Trends – Market Potential and Future Outlook
#Business Strategy #Market and Competitor Analysis #Graph
