Future Outlook Analysis Graph – Market and Technology Analysis
RJ0600110_27
- Last Update 07/21/2025
- File Size 4.4MB
- # of Slides 2
- File Format PPTX
- Slide Ratio 16:9
- Color
Keywords
- #Content-Based Slides
- #Design-Based Slides
- #Technical Approach
- #Market and Competitor Analysis
- #Graph
- #Future Development Roadmap
- #Future Outlook
- #Column
- #Segmented Column
- #16:9
- #stacked bar chart PowerPoint
- #market analysis slide template
- #technology trend graph
- #how to create stacked bar chart in PowerPoint
- #future outlook presentation slide
About the Product
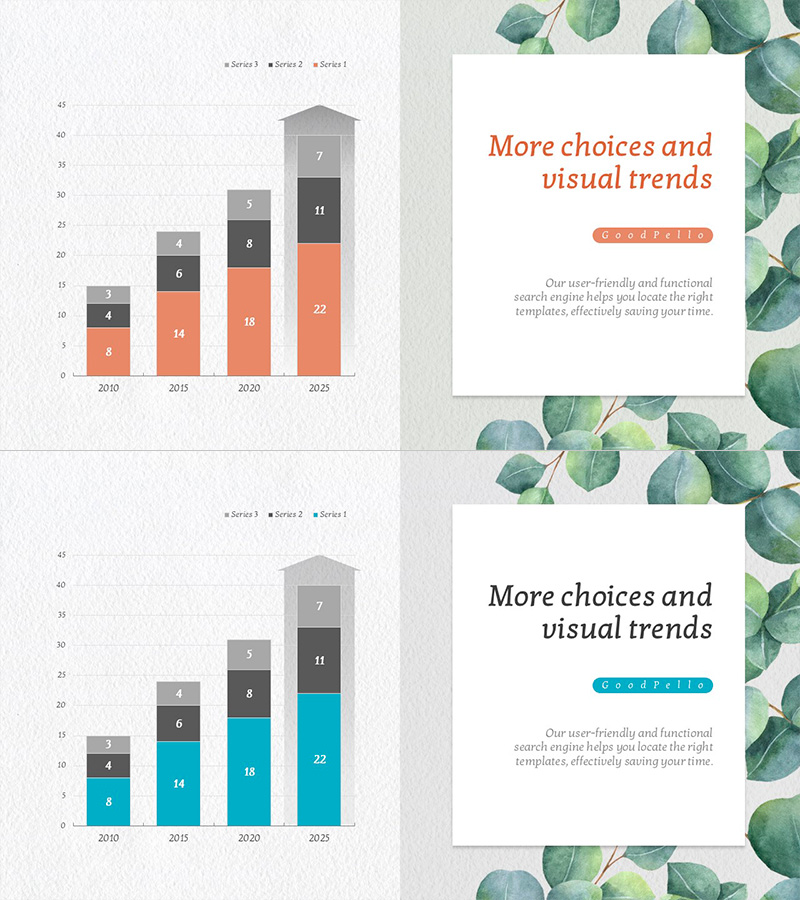
A stacked bar chart PowerPoint slide designed to visualize future market and technology outlook analysis. This presentation template displays four data series from 2010 to 2025 in cumulative bar format, clearly showing trends and changes over time. The orange and gray color scheme effectively differentiates each series, with precise numerical labels for immediate use in business presentations, reports, and analytical documents. The 16:9 aspect ratio with 2-slide layout provides flexibility for various presentation scenarios.
Usage Points
-
Main Usage
Visualize multi-series cumulative data such as market size changes, technology advancement trends, and sector-specific growth rates to communicate future outlook clearly. Supports data-driven decision-making in executive briefings, investor pitches, and strategic planning meetings.
-
How to Use
Hover over each year's bar to view numerical values, or add analysis notes in the slide notes section during presentation. Colors and series order are fully editable to match corporate branding guidelines. Additional years can be added by duplicating existing bars and updating data values.
-
Recommended For
Executive and C-level quarterly or annual business reviews, marketing team market analysis presentations, technology department R&D roadmap explanations, investor relations (IR) materials, and consulting firm strategic proposals.
-
Slide Structure
Slide 1: 4-series stacked bar chart (2010, 2015, 2020, 2025), legend with 3 entries, vertical axis scale 0-45, all data labels visible. Slide 2: Identical structure with alternative color scheme (orange to blue tones), both versions include series-specific numerical labels.
Related Products
-

Graph of Future Development of Calligraphy – Revenue Projections and Expectations
#Business Strategy #Technical Approach #Graph
-

The Curve of Football Development - Market Analysis and Future Outlook
#Technical Approach #Market and Competitor Analysis #Graph
-

Graph of Changes in Media Utilization
#Market and Competitor Analysis #Graph #Future Outlook
-

Arctic Business Market Analysis Chart by Year – Visualizing Business Goals
#Business Vision and Strategy #Market and Competitor Analysis #Diagram
