Identity Wide Template – Double Horizontal Bar Graph Usage
RJ0200003_13
- Last Update 03/29/2025
- File Size 0.3MB
- # of Slides 2
- File Format PPTX
- Slide Ratio 16:9
- Color
Keywords
- #Content-Based Slides
- #Design-Based Slides
- #Market and Competitor Analysis
- #Graph
- #Competitive Advantage
- #Horizontal Bar
- #Double Horizontal Bar
- #16:9
- #dual horizontal bar chart PowerPoint
- #two-series data comparison slide
- #market analysis presentation template
- #competitive analysis PPT
- #how to create horizontal bar chart in PowerPoint
About the Product
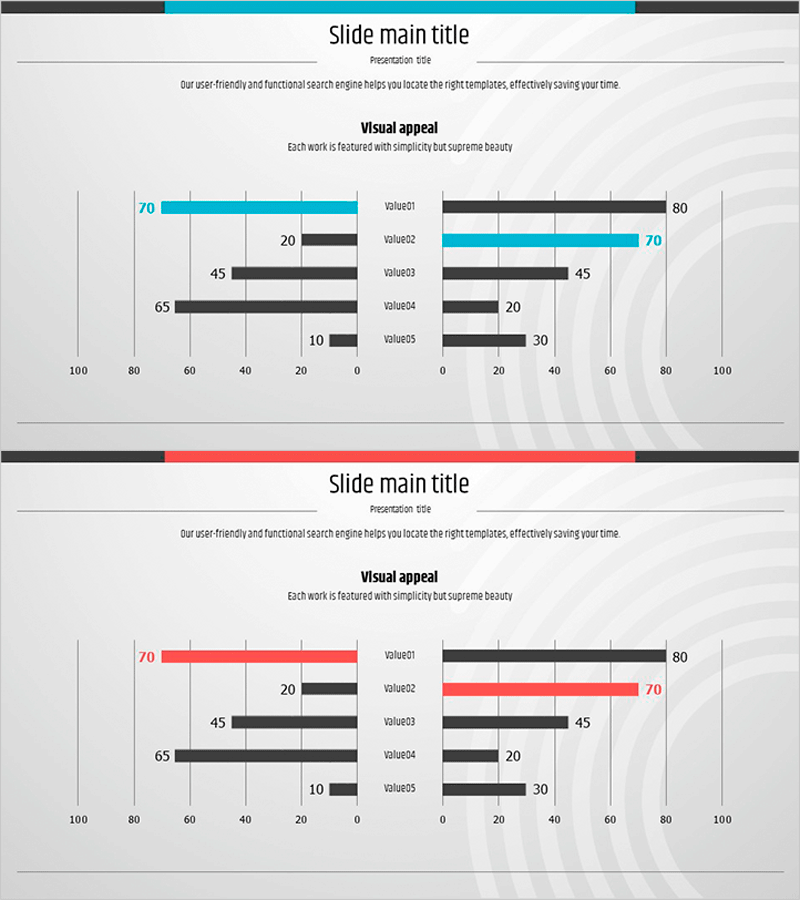
A PowerPoint slide featuring two independent horizontal bar charts positioned symmetrically to compare different data series side by side. Ideal for market analysis, competitive benchmarking, performance metrics comparison, and business presentations. The design uses cyan blue and charcoal gray to distinguish data series clearly, with numeric labels on each bar for intuitive information delivery. Available in 16:9 widescreen format with 2 slides ready for immediate editing. Perfect for corporate presentations, marketing plans, business reports, and strategic analysis documents.
Usage Points
-
Main Usage
Designed to display and compare two independent data series using symmetrical left-right bar chart layout. Effectively visualizes market share comparisons, competitive performance analysis, departmental results comparison, and time-series trend analysis with quantitative precision.
-
How to Use
Replace the numeric values with your own data and update the legend and axis labels accordingly. Maintain the cyan and charcoal color scheme to preserve series distinction, and add custom titles and descriptive text to enhance presentation context and narrative flow.
-
Recommended For
Marketing professionals, sales managers, business analysts, management consultants, and executives presenting quantitative comparative analysis. Particularly effective for competitive analysis, market research, performance evaluation, and strategic planning presentations.
-
Slide Structure
Two-slide set with symmetrical dual horizontal bar charts on each slide. Left chart displays 5 data points (70, 20, 45, 65, 10) and right chart shows 5 data points (80, 70, 45, 20, 30). Color-coded with cyan blue and charcoal gray to distinguish data series clearly.
Related Products
-

Business Competitor Analysis Graph
#Market and Competitor Analysis #Graph #Competitor Analysis
-

Sales Comparison Graph by Product – Competitive Advantage and Performance Analysis
#Market and Competitor Analysis #Financial Plans and Performance #Graph
-

Competitor Analysis and Advantage Chart – The Harmony of Blue and Red
#Market and Competitor Analysis #Graph #Competitor Analysis
-

Blue Red Two-way Graph – Highlighting Competitive Advantage
#Business Strategy #Market and Competitor Analysis #Graph
