Visualizing Market and Competition Analysis with Line Charts
RJ0200003_12
- Last Update 03/29/2025
- File Size 0.3MB
- # of Slides 2
- File Format PPTX
- Slide Ratio 16:9
- Color
Keywords
- #Content-Based Slides
- #Design-Based Slides
- #Market and Competitor Analysis
- #Marketing Plan and Strategy
- #Graph
- #Future Outlook
- #Marketing Strategy
- #Line
- #Line Chart
- #16:9
- #line chart PowerPoint slide
- #trend analysis presentation template
- #market comparison chart
- #multi-series line graph
- #competitive analysis PowerPoint
- #how to create line chart in PowerPoint
About the Product
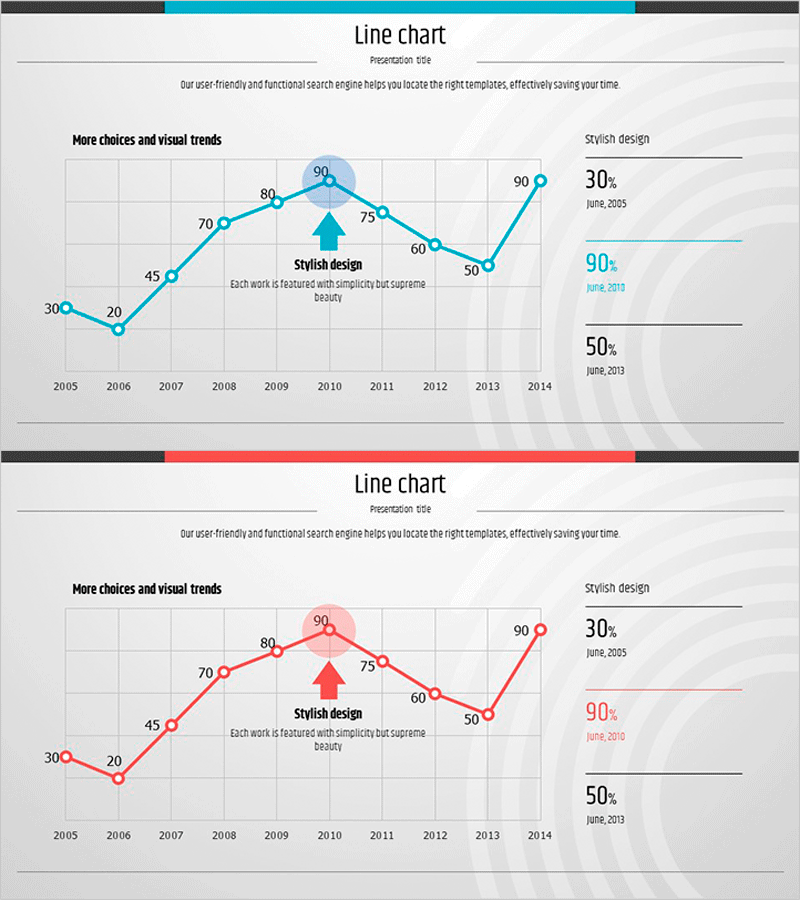
A professional line chart PowerPoint slide template tracking market performance from 2005 to 2014. This presentation slide features dual-series data visualization in blue and red, enabling side-by-side comparison of market trends and competitive performance. Each data point displays numerical labels, with peak values highlighted by directional arrows and annotation boxes to emphasize key insights. The right panel organizes critical metrics (30%, 90%, 50%) in a separate section for enhanced clarity. This PowerPoint template is ready for immediate use in marketing plans, market analysis reports, executive presentations, and competitive intelligence briefings.
Usage Points
-
Main Usage
Visualizes long-term market trends and competitive performance simultaneously, enabling clear year-over-year comparison. Provides compelling data representation for executive briefings, investor presentations, and marketing strategy discussions.
-
How to Use
Replace the data points and numerical labels with your actual market figures. Update the right-side metrics panel with your key performance indicators, and use the central highlight arrow and annotation box to emphasize the most critical inflection point for audience focus.
-
Recommended For
Marketing managers, business analysts, sales executives, financial analysts, and consultants presenting market conditions and competitive positioning. Particularly effective for demonstrating multi-year performance trends, market share evolution, and competitive advantages.
-
Slide Structure
X-axis displays years (2005-2014), Y-axis shows values (0-90), dual-series line chart in blue and red with numerical labels at each data point, peak value highlighted with directional arrow and text annotation, right panel contains three key metrics (30%, 90%, 50%) in separate display areas across 2 slides.
Related Products
-

Navigation App Market Trends and Outlook
#Market and Competitor Analysis #Graph #Future Outlook
-

Real Estate Upside Down Chart – Visualizing Market Trends
#Market and Competitor Analysis #Financial Plans and Performance #Graph
-

Four Color Infographic Presentation Template – Market Status and Forecast
#Market and Competitor Analysis #Graph #Market Status
-

Color Theme Presentation Template for Line Charts
#Business Strategy #Market and Competitor Analysis #Graph
