Four Color Infographic Presentation Template – Market Status and Forecast
RJ0200037_15
- Last Update 04/08/2025
- File Size 0.1MB
- # of Slides 2
- File Format PPTX
- Slide Ratio 16:9
- Color
Keywords
About the Product
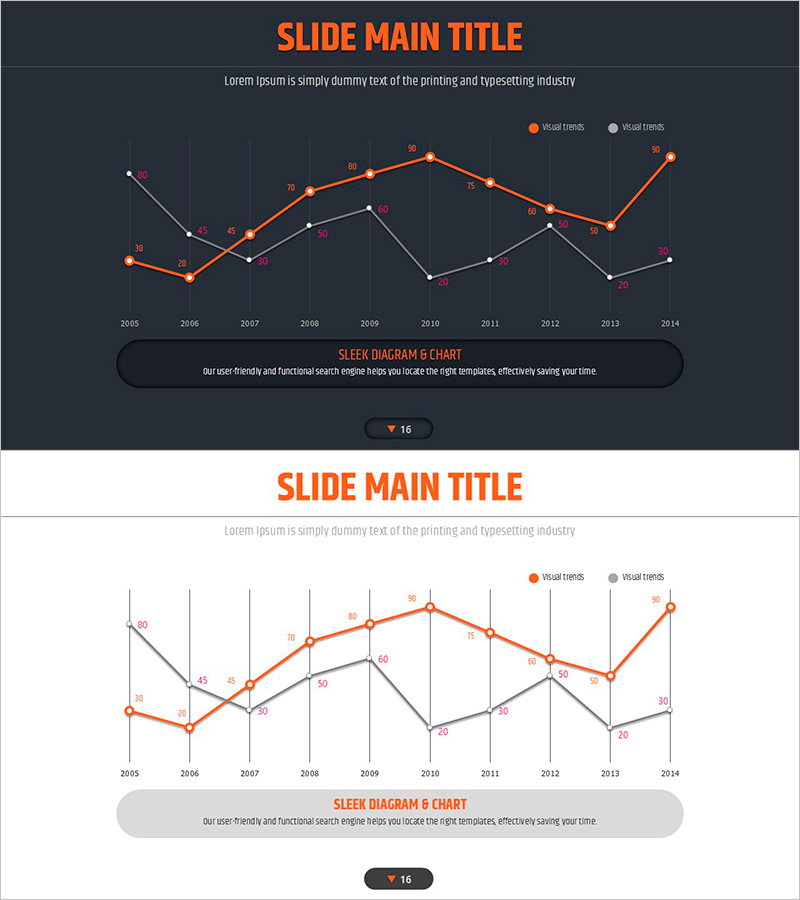
A professional line chart PowerPoint slide visualizing 10 years of market performance and forecast trends from 2005 to 2014. The dual-series design uses orange and gray lines to compare two datasets simultaneously, making it ideal for competitive analysis, revenue trends, market share evolution, and performance benchmarking. Optimized for 16:9 widescreen format with 2-slide variations: dark background and light background options. Each data point includes numeric labels for precise information delivery. Ready to use in business reports, quarterly presentations, investor pitches, and strategic planning decks with fully editable data values and labels.
Usage Points
-
Main Usage
Visualize annual performance changes, market share evolution, competitive benchmarking, and future forecasts through time-series data. The dual-line format enables direct comparison of two metrics, revealing correlations, divergences, and performance gaps at a glance.
-
How to Use
Insert into business performance reports, quarterly earnings presentations, investor relations materials, market analysis decks, and strategic planning documents. Simply replace the sample data values and labels with your actual figures. Both dark and light background versions adapt to different presentation themes and corporate branding.
-
Recommended For
C-suite executives, finance teams, marketing strategists, sales managers, business consultants, academic researchers, and any professional presenting quantitative trends. Suitable for board meetings, investor pitches, annual reports, competitive analysis, and data-driven decision-making sessions.
-
Slide Structure
Two fully-designed slides: Dark background version with orange and gray dual-series lines tracking 10 annual data points (2005-2014) with numeric labels. Light background version with identical chart structure. Both include legend, axis labels, descriptive text box, and fully editable data fields for customization.
Related Products
-

Line Graph Slide Visualizing Ocean Market Trends
#Market and Competitor Analysis #Graph #Market Status
-

Simple Circle Presentation Template Line Chart – Visualizing Market Status
#Market and Competitor Analysis #Graph #Market Status
-

Market Status and Future Outlook – Data Illustrated in Blue and Yellow
#Market and Competitor Analysis #Graph #Market Status
-

Successful Proposition Strategy through Market and Competitive Analysis
#Market and Competitor Analysis #Graph #Market Status
