Real Estate Upside Down Chart – Visualizing Market Trends
RJ0900002_15
- Last Update 08/15/2025
- File Size 0.1MB
- # of Slides 2
- File Format PPTX
- Slide Ratio 16:9
- Color
Keywords
- #Content-Based Slides
- #Design-Based Slides
- #Market and Competitor Analysis
- #Financial Plans and Performance
- #Graph
- #Future Outlook
- #Sales and Revenue
- #Line
- #Line Chart
- #16:9
- #line chart PowerPoint
- #dual-series trend graph
- #real estate market slide
- #financial data visualization
- #how to create line chart in PowerPoint
- #market analysis slide template
About the Product
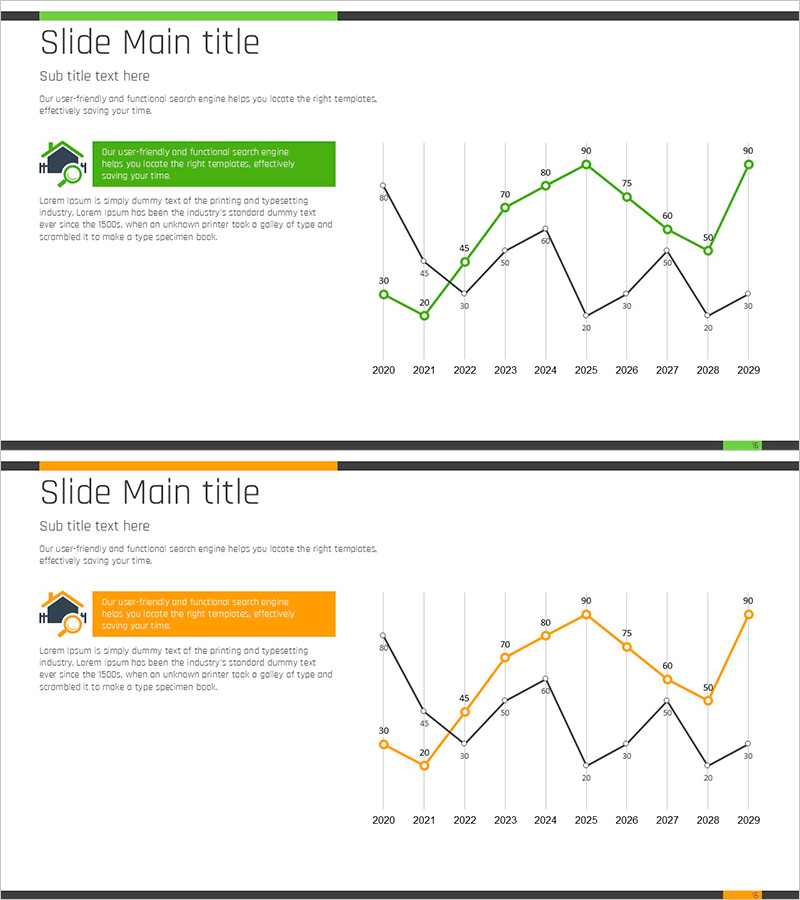
A dual-line chart PowerPoint slide optimized for real estate market analysis and financial planning presentations. This slide visualizes 10-year market trends from 2020 to 2029 using two data series represented in green and black lines, clearly showing upward and downward movements. Each data point is labeled with precise numerical values for accurate comparison, making it ideal for business reports, pitch decks, and strategic planning documents. The 16:9 widescreen format includes 2 fully editable slides in PPTX format, ready for immediate customization and deployment.
Usage Points
-
Main Usage
Effectively communicate real estate market analysis, financial performance trends, and comparative business metrics across time periods. The dual-line format enables clear visualization of two competing or complementary data series, making it ideal for executive presentations and strategic decision-making materials.
-
How to Use
Insert into the market analysis or performance reporting section of your presentation to provide data-driven insights. Simply replace the existing data labels and axis values with your actual figures, and adjust colors and line styles to match your corporate branding for immediate use.
-
Recommended For
Real estate professionals, financial analysts, investment managers, consultants, and business executives presenting market trends, quarterly earnings reports, investment proposals, or competitive analysis to stakeholders and decision-makers.
-
Slide Structure
Dual-line chart with 10-year timeline (2020–2029) on the horizontal axis and numerical scale (0–90) on the vertical axis. Each data point displays precise values, with legend and descriptive text areas included for context and interpretation.
Related Products
-

Comparison Graph by Transportation Industry – Market Analysis and Financial Performance
#Market and Competitor Analysis #Financial Plans and Performance #Graph
-

Origami Presentation Template Section Line Graph – Market and Performance Analysis
#Market and Competitor Analysis #Financial Plans and Performance #Graph
-

Rising Curve Graph for Sales Growth – Looking Ahead
#Market and Competitor Analysis #Financial Plans and Performance #Graph
-

Market Trends with Key Focus Areas
#Market and Competitor Analysis #Financial Plans and Performance #Graph
