Navigation App Market Trends and Outlook
RJ0400039_8
- Last Update 05/28/2025
- File Size 1MB
- # of Slides 2
- File Format PPTX
- Slide Ratio 16:9
- Color
Keywords
About the Product
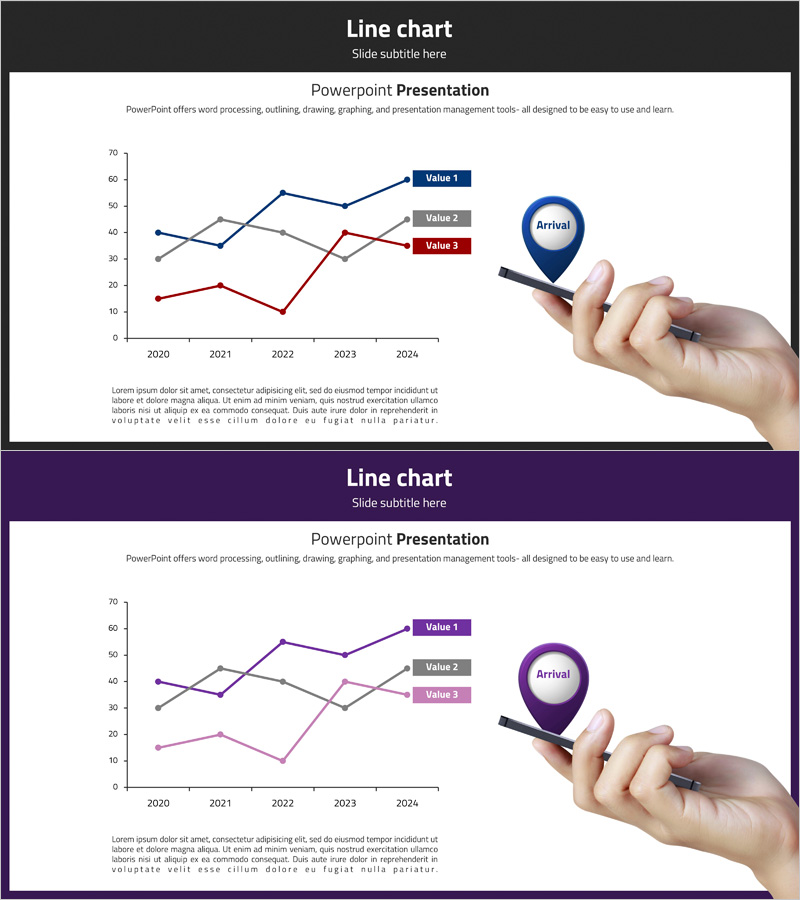
A multi-series line chart PowerPoint slide visualizing navigation app market trends across three data series from 2020 to 2024. This presentation template tracks competitive performance and market growth trajectories with blue, gray, and red line series on a dark gray background. Clear legend labels and data point markers enhance readability for business presentations. The slide includes a location pin icon and hand gesture imagery to emphasize market arrival and growth momentum. Ideal for market analysis reports, investor presentations, and strategic planning documents requiring time-series data visualization.
Usage Points
-
Main Usage
Visualizes market trends, competitive performance, and growth rates across multiple time periods. The three line series represent different products, companies, or regions, enabling direct comparative analysis. Effectively displays long-term trajectory changes over a five-year span for strategic decision-making.
-
How to Use
Deploy in business presentations, market analysis reports, and investor pitch decks to explain competitive landscape and market direction. Customize line colors to match your corporate branding or data categories. Edit legend labels and data values to reflect your specific metrics and performance indicators.
-
Recommended For
Marketing professionals, strategy planners, sales executives, and investor relations teams. Particularly effective for presenting market size evolution, customer acquisition trends, revenue growth rates, and market share changes. Valuable for industry analysis, competitive benchmarking, and business planning phases.
-
Slide Structure
Two-slide set, each featuring a 3-series line chart. Horizontal axis spans 2020-2024 years; vertical axis ranges from 0-70 units. Blue, gray, and red lines represent Value 1, 2, and 3 respectively. Location pin icon and hand gesture image positioned on the right side. Bottom section includes descriptive text area for additional insights and annotations.
Related Products
-

Market Trends & Future Outlook Graph – An Intuitive Presentation Template
#Market and Competitor Analysis #Graph #Other
-

Trend Analysis of Drug Response – Market and Competitor Analysis
#Market and Competitor Analysis #Graph #Future Outlook
-

Current Status and Prospects of Cultivation – Market Analysis Graph
#Market and Competitor Analysis #Graph #Future Outlook
-

Future Outlook Chart for Renewable Energy Business – Market Trend Analysis
#Market and Competitor Analysis #Graph #Future Outlook
