Backpack Travel Vertical Bar Graph – Market Status and Competitive Advantage
RJ0600102_21
- Last Update 07/18/2025
- File Size 0.8MB
- # of Slides 2
- File Format PPTX
- Slide Ratio 16:9
- Color
Keywords
About the Product
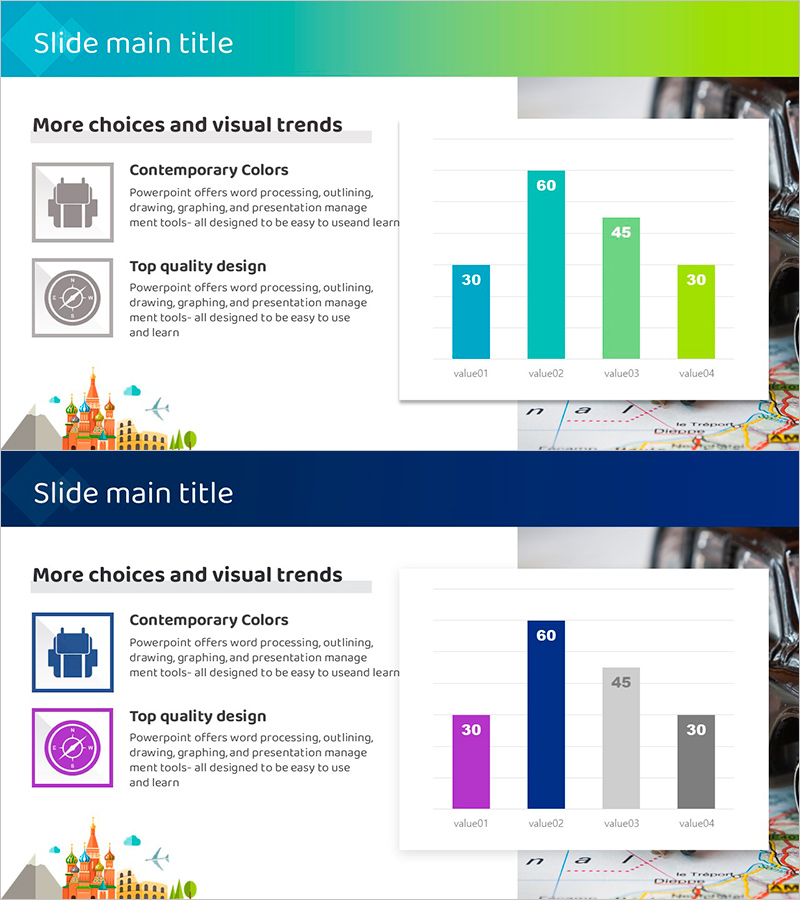
A vertical bar chart PowerPoint slide designed to compare market status and competitive advantage at a glance. This presentation template features four data series in teal, green, and gray colors, enabling clear visualization of up to four items of numerical data. Optimized for travel, tourism, and travel industry presentations, it works effectively for expressing market size, customer satisfaction, competitor benchmarking, and other data comparisons. The 2-slide set in 16:9 widescreen format is ready to edit and insert into your presentation immediately.
Usage Points
-
Main Usage
This slide visualizes four numerical data items—such as market size, customer satisfaction, competitor performance, and growth rate—using a vertical bar chart format. It is ideal for travel, tourism, and consumer goods industry presentations where you need to demonstrate market conditions objectively and highlight competitive advantages.
-
How to Use
Replace the numerical values (30, 45, 60, 30) displayed above each bar with your actual data. Update the legend labels (value01–value04) with your item names. Colors can be adjusted to match your corporate brand identity, and you can enhance context by modifying the left-side icons and descriptive text.
-
Recommended For
Travel agencies, tourism boards, airlines, and hospitality businesses; marketing teams preparing market analysis reports; executives presenting competitive landscape; and startup founders pitching market opportunities at investor presentations.
-
Slide Structure
The 2-slide set features a consistent layout with a gradient header area, a left explanation section containing two icons and descriptive text, and a right graph area with four vertical bars, numerical labels, and a legend. Bars are color-coded in teal, green, and gray series with values displayed above each bar.
Related Products
-

Tourist Destination Preference Analysis – Stylish Bar Chart Design
#Market and Competitor Analysis #Graph #Market Status
-

Weather Bar Graph - Market Status Analysis
#Market and Competitor Analysis #Graph #Market Status
-

3D Bar Graph for Market Performance Analysis – Slide Highlighting Competitive Edge
#Market and Competitor Analysis #Graph #Market Status
-

Infographic Design Wide Template Chart2 for Market Analysis
#Market and Competitor Analysis #Graph #Market Status
