Strategic Market Analysis Bar Chart
RJ0300009_7
- Last Update 04/20/2025
- File Size 0.3MB
- # of Slides 2
- File Format PPTX
- Slide Ratio 16:9
- Color
Keywords
About the Product
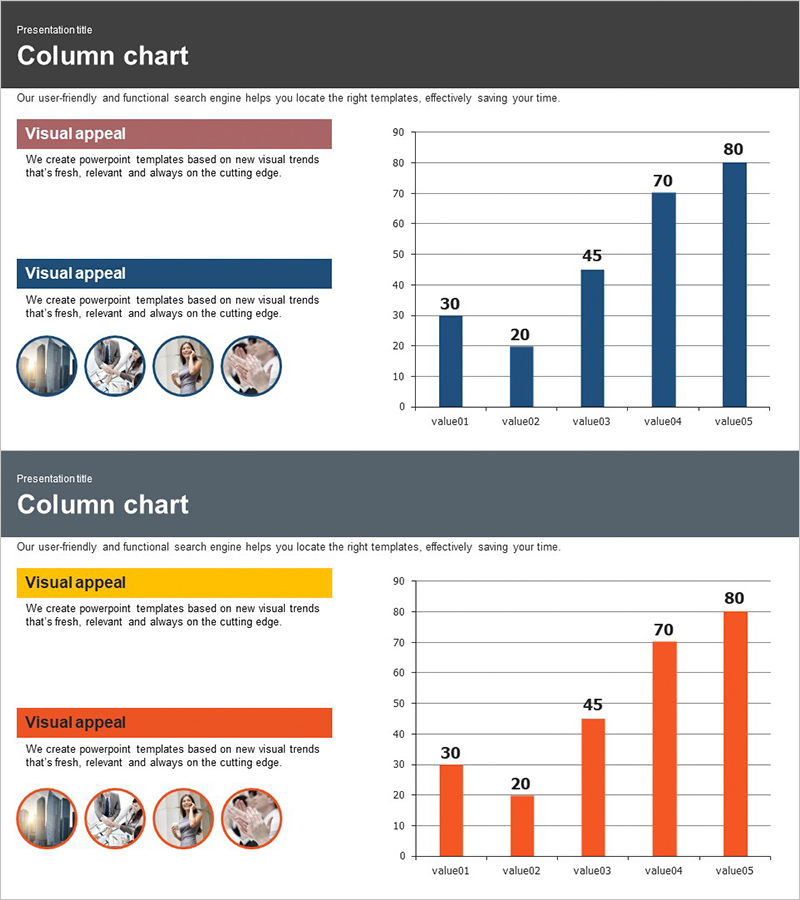
A vertical bar chart PowerPoint slide optimized for market analysis and competitive benchmarking. This presentation template displays five data points ranging from 30 to 80 in a clear, comparative format. Two color schemes—dark blue and orange—are provided to suit corporate presentations and marketing strategy documents. The 2-slide deck is formatted in 16:9 widescreen ratio, ensuring compatibility with modern presentation environments. Each bar is precisely scaled to highlight performance differences and facilitate data-driven decision-making.
Usage Points
-
Main Usage
Visualize market conditions, compare competitor performance, track sales metrics, and present quarterly results using five quantitative data points. The bar heights immediately convey ranking and performance gaps to your audience.
-
How to Use
Ideal for business presentations, marketing strategy documents, quarterly performance reports, and market research findings. Simply edit the labels and values to match your dataset. The template maintains professional formatting while accommodating your specific data.
-
Recommended For
Marketing managers, sales directors, executives, management consultants, and market research professionals preparing data-driven presentations. Particularly effective when quantitative comparison is essential to your argument.
-
Slide Structure
Two-slide template featuring identical bar chart layouts in different color schemes. Each slide includes a title area, descriptive text box, gridlined chart background, and five vertical bars with value labels (30, 20, 45, 70, 80). Fully editable for custom data input.
Related Products
-

Weather Change Vertical Bar Graph Analysis - Understanding Market Status
#Market and Competitor Analysis #Graph #Market Status
-

Bar Chart for Portion of Meals – Visualizing Market Status
#Market and Competitor Analysis #Graph #Market Status
-

Horizontal Bar Chart for Recent Case Receipt Trends – Market Status
#Market and Competitor Analysis #Graph #Market Status
-

Consumer Insights & Behavioral Patterns Analysis Slide
#Market and Competitor Analysis #Graph #Market Status
