Visualizing Market Share with Pie Chart – Insights and Strategies
RJ0200002_4
- Last Update 03/29/2025
- File Size 0.4MB
- # of Slides 2
- File Format PPTX
- Slide Ratio 16:9
- Color
Keywords
About the Product
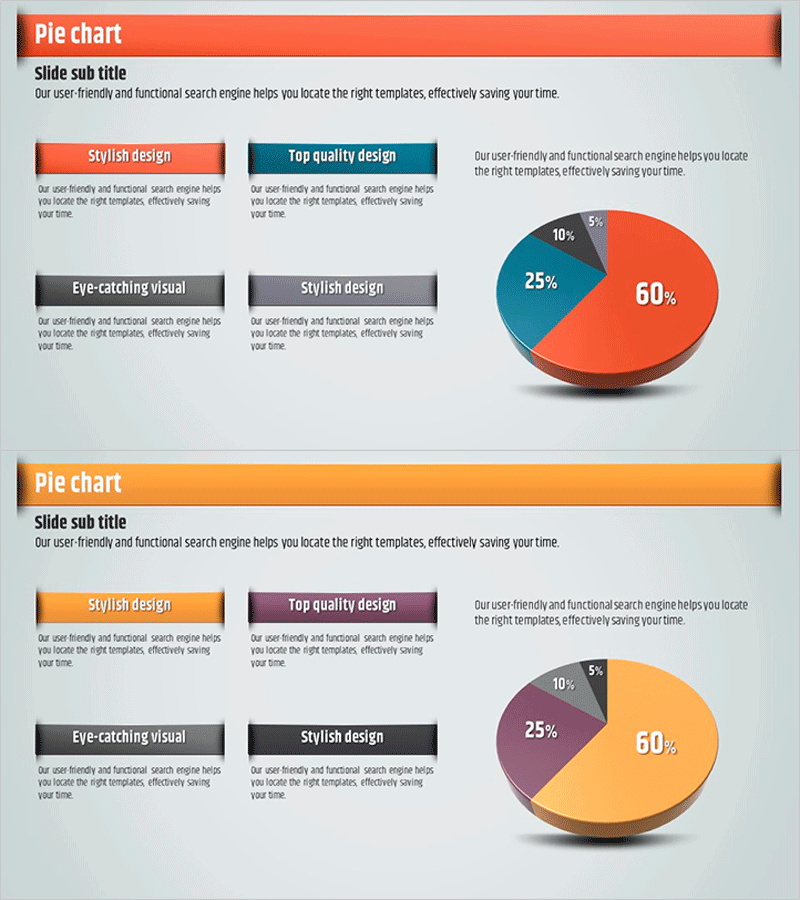
A professional pie chart PowerPoint slide designed to visualize market share and business performance with clarity and impact. The 3D pie graph uses warm orange and cool blue tones to represent four data segments with percentage labels, making data interpretation immediate and intuitive. Text box areas on the left side allow you to add detailed descriptions for each segment, enabling seamless integration into presentations and business reports. The 2-slide set provides multiple color variations so you can match your brand identity and presentation theme while maintaining consistent data visualization.
Usage Points
-
Main Usage
Effectively communicate market share distribution, revenue breakdown, customer composition, and product sales ratios at a glance. Ideal for executive presentations, investor pitch decks, and marketing strategy meetings where key proportional data must be clearly emphasized.
-
How to Use
Enter segment names and descriptions in the left text boxes, then update the percentage values in the pie chart with your actual data. Two color schemes are provided—orange-blue and orange-purple—allowing you to select the version that best matches your presentation theme and corporate branding.
-
Recommended For
Executives, marketing managers, financial analysts, and sales leaders presenting quarterly results, market analysis, and customer segmentation data. Perfect for business plans, proposals, and performance reports requiring data visualization sections.
-
Slide Structure
The 2-slide set features one 4-segment pie chart per slide with a 3D visual effect. Each chart is accompanied by a text box area on the left for four data segments, allowing you to display both legend information and detailed explanations simultaneously.
Related Products
-

Graph Ratio by Subject – Education Market Analysis
#Market and Competitor Analysis #Graph #Market Share
-

Purchase Volume Comparison Analysis Circle Graph – Understanding Market Share
#Product/Service Introduction #Market and Competitor Analysis #Graph
-

User Analysis on Coffee and Smoking – Market Trends and Insights
#Market and Competitor Analysis #Graph #Other
-

Pie Chart and Chopa Illustration – Market Analysis Slide
#Market and Competitor Analysis #Financial Plans and Performance #Graph
