Presentation Slide Visualizing Company Performance with Column Chart
RJ0200001_8
- Last Update 03/29/2025
- File Size 0.1MB
- # of Slides 2
- File Format PPTX
- Slide Ratio 16:9
- Color
Keywords
- #Content-Based Slides
- #Design-Based Slides
- #Company Introduction
- #Market and Competitor Analysis
- #Diagram
- #Graph
- #Key Achievements
- #Market Analysis
- #Table
- #Column
- #Standard Table
- #Horizontal Table
- #Column Chart
- #16:9
- #column chart PowerPoint slide
- #bar graph presentation template
- #company performance visualization
- #data comparison chart
- #5-item column chart template
About the Product
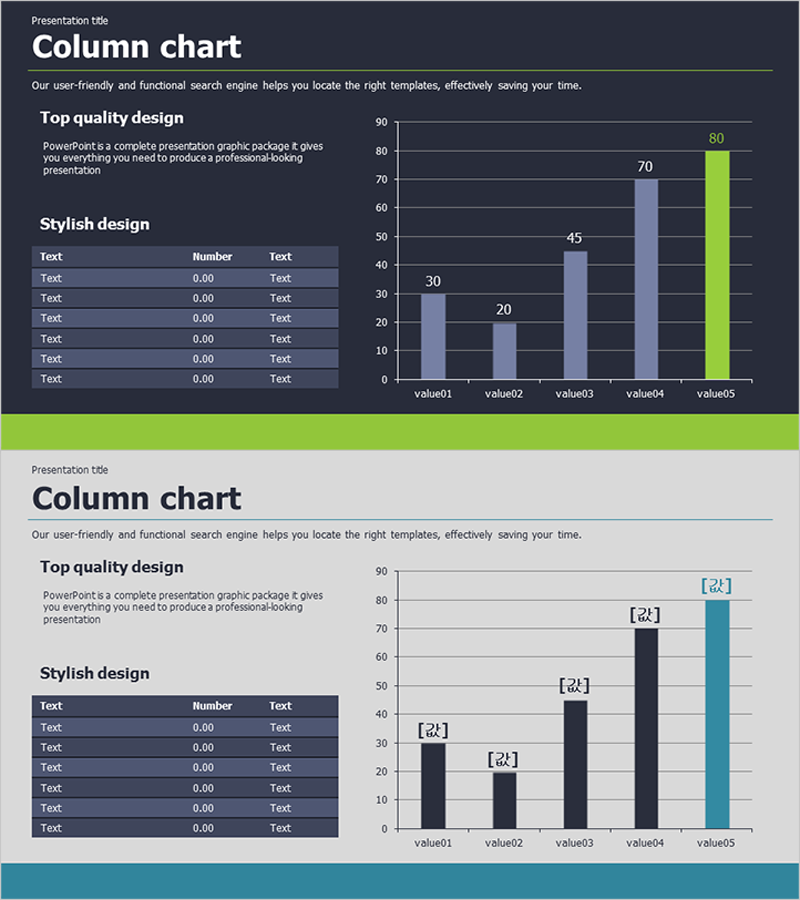
A PowerPoint slide featuring a 5-item column chart for visualizing quantitative business data. Two design versions are included: dark theme with lime green accents and light theme with teal accents. Each slide combines a data table on the left with a corresponding column chart on the right, making it ideal for presenting company performance, market analysis, and competitive comparisons. Delivered in 16:9 widescreen PPTX format, fully editable and ready to use in presentations, reports, and analytical documents.
Usage Points
-
Main Usage
Designed to compare and analyze quantitative data across five categories such as sales, performance metrics, or KPIs. The column heights visually represent numerical differences at a glance, while the accompanying data table on the left provides precise figures. Perfect for executive briefings, quarterly performance reviews, and market analysis presentations.
-
How to Use
Simply replace the table values and chart data with your own numbers. The dark theme suits professional executive presentations, while the light theme works well for educational seminars and training materials. The chart automatically updates when you modify the table values, eliminating manual chart adjustments.
-
Recommended For
Finance and executive reporting professionals, marketing analysts, sales presenters, management consultants, and academic researchers. Particularly useful for quarterly and annual performance reviews, competitive benchmarking, market share analysis, and departmental KPI assessments.
-
Slide Structure
Each slide features a title area at the top, a 7-row data table on the left (three columns: Text, Number, Text), and a 5-item column chart on the right (value01 through value05, 0–90 scale). The dark version uses dark gray chart background with blue and lime green bars; the light version employs a bright background with dark bars and teal accents.
Related Products
-

Global Target Market Analysis Graph
#Market and Competitor Analysis #Diagram #Graph
-

Comparative Analysis of Eco-Friendly Categories Slide – Market Competitive Advantage
#Market and Competitor Analysis #Financial Plans and Performance #Diagram
-

Blue Red Analysis Chart – New Insights into Market Analysis
#Market and Competitor Analysis #Diagram #Graph
-

Market Trend Analysis Bar Graph & Table
#Market and Competitor Analysis #Diagram #Graph
