Performance Analysis 3D Bar Chart & Table – Market and Performance Analysis
RM0300012_17
- Last Update 02/10/2025
- File Size 1MB
- # of Slides 2
- File Format PPTX
- Slide Ratio 16:9
- Color
Keywords
- #Content-Based Slides
- #Design-Based Slides
- #Company Introduction
- #Market and Competitor Analysis
- #Diagram
- #Graph
- #Key Achievements
- #Market Analysis
- #Table
- #Horizontal Bar
- #Standard Table
- #Horizontal Bar Chart
- #16:9
- #3D bar chart PowerPoint
- #performance analysis slide template
- #data table presentation
- #market analysis graph
- #bar chart slide download
About the Product
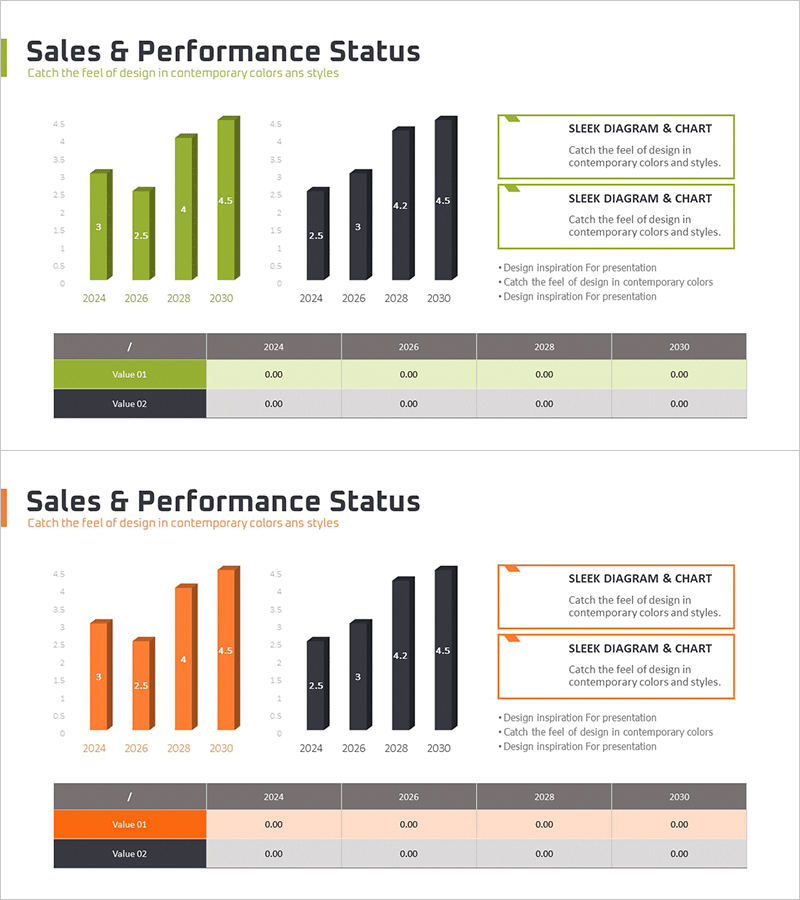
A two-slide PowerPoint presentation combining 3D bar charts and data tables to visualize performance metrics and market analysis. Designed with lime green and charcoal black dual-tone color scheme, the first slide features two 3D bar graphs displaying year-over-year trends from 2024 to 2030, while the second slide presents corresponding numerical data in a structured table format. Ideal for business reports, quarterly reviews, and investment presentations where quantitative performance indicators and market insights need to be communicated simultaneously. Delivered in 16:9 widescreen PPTX format for immediate editing and customization.
Usage Points
-
Main Usage
Presents quantitative performance trends and market analysis data through comparative visualization. The 3D bar graphs convey numerical changes over time intuitively, while the accompanying table provides precise data values to reinforce presentation credibility and analytical depth.
-
How to Use
Apply to business reports, quarterly performance reviews, investor presentations, and market analysis documents in the results comparison section. Replace chart values with actual data, modify table headers and rows, and adjust colors as needed. Ready-to-use format requires minimal customization.
-
Recommended For
Suitable for finance, sales, marketing, and executive-level presentations. Recommended for quarterly and annual performance reporting, market trend analysis, and strategic planning documents. Ideal for professionals in planning, strategy, and analytics roles requiring data-driven decision-making materials.
-
Slide Structure
Slide 1: Lime green background with two 3D bar graphs displaying four-year data (2024–2030) with four bars per chart. Slide 2: Data table with charcoal black header row and alternating lime green and white data rows (5 rows × 5 columns for year and metric entries).
Related Products
-

Future Outlook & Competitor Analysis Chart
#Company Introduction #Market and Competitor Analysis #Diagram
-

Competitor and Customer Analysis Horizontal Bar Graph and Table
#Market and Competitor Analysis #Diagram #Graph
-

Key Business Performance Analysis Chart – A Measure of Trust
#Company Introduction #Market and Competitor Analysis #Diagram
-

Blue Green Horizontal Bar Graph – Optimized for Market and Competitive Analysis
#Market and Competitor Analysis #Diagram #Graph
