Line Chart for Market and Competitive Analysis – Future Outlook and Investment Returns
RJ0200001_12
- Last Update 03/28/2025
- File Size 0.1MB
- # of Slides 2
- File Format PPTX
- Slide Ratio 16:9
- Color
Keywords
- #Content-Based Slides
- #Design-Based Slides
- #Market and Competitor Analysis
- #Financial Plans and Performance
- #Graph
- #Future Outlook
- #Projected Return on Investment (ROI)
- #Line
- #Line Chart
- #16:9
- #line chart PowerPoint
- #line graph slide template
- #market analysis chart
- #trend comparison
- #ROI PowerPoint slide
About the Product
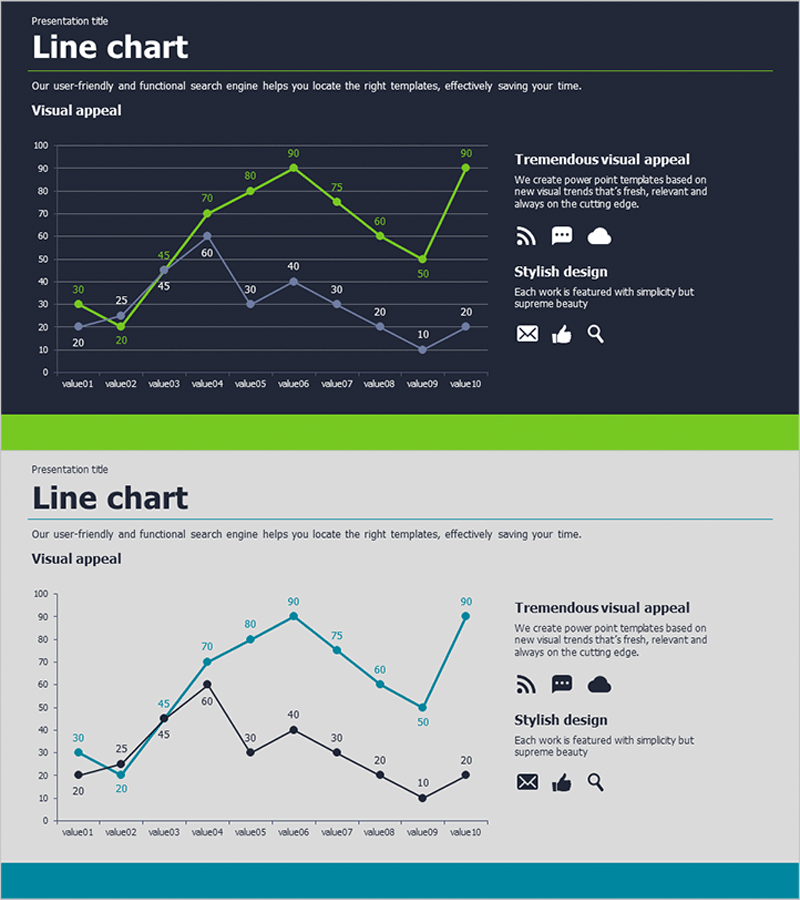
A line chart PowerPoint slide optimized for market analysis and competitive benchmarking. The dark blue background features two data series in lime green and navy blue, tracking changes across 10 data points with clear trend visualization. Each data point is labeled with numerical values for precise comparison, and a text area on the right side allows you to add insights and analysis. This presentation template is ready to use for financial analysis, market trends, ROI forecasting, and any quantitative data visualization in business reports and investor pitches.
Usage Points
-
Main Usage
Visualizes changes over time for market trends, competitor performance, and financial metrics using two or more data series. The dark blue background with high contrast ensures data points remain clearly visible on large conference room screens and projectors.
-
How to Use
Slide 1 features a dark blue background version; Slide 2 provides a light gray alternative. Double-click the chart to open the Excel data table and input your values—the graph updates automatically. Add your analysis findings or future projections in the text area on the right to complete the slide.
-
Recommended For
Quarterly financial reports for CFOs, market share analysis for marketing teams, ROI presentations to executives, client proposals for consulting firms, and investor pitch decks for startups seeking funding.
-
Slide Structure
2-slide set. Slide 1: Dark blue background with dual-series line chart (lime green and navy), 10 data points with numerical labels, and right-aligned text box. Slide 2: Light gray background with identical chart structure. 16:9 widescreen format, fully editable PPTX compatible with all PowerPoint versions.
Related Products
-

Camping Isometric Future Market Outlook Line Graph
#Market and Competitor Analysis #Financial Plans and Performance #Graph
-

Line Graph Slide Visualizing Ocean Market Trends
#Market and Competitor Analysis #Graph #Market Status
-

Liquor Sales Line Chart – Visualizing Revenue and Profit
#Financial Plans and Performance #Graph #Projected Return on Investment (ROI)
-

Graph Slide Showing Status of Food Truck Sales
#Financial Plans and Performance #Diagram #Graph
