Market Analysis Visualization with Vertical Stacked Column Chart – Efficient Competitor Analysis
RJ0200001_10
- Last Update 03/28/2025
- File Size 0.1MB
- # of Slides 2
- File Format PPTX
- Slide Ratio 16:9
- Color
Keywords
- #Content-Based Slides
- #Design-Based Slides
- #Market and Competitor Analysis
- #Financial Plans and Performance
- #Graph
- #Market Analysis
- #Tax Strategy and Benefits
- #Column
- #Segmented Column
- #16:9
- #stacked column chart PowerPoint
- #vertical 100% stacked bar graph
- #market analysis slide template
- #data comparison presentation
- #how to create stacked chart in PowerPoint
About the Product
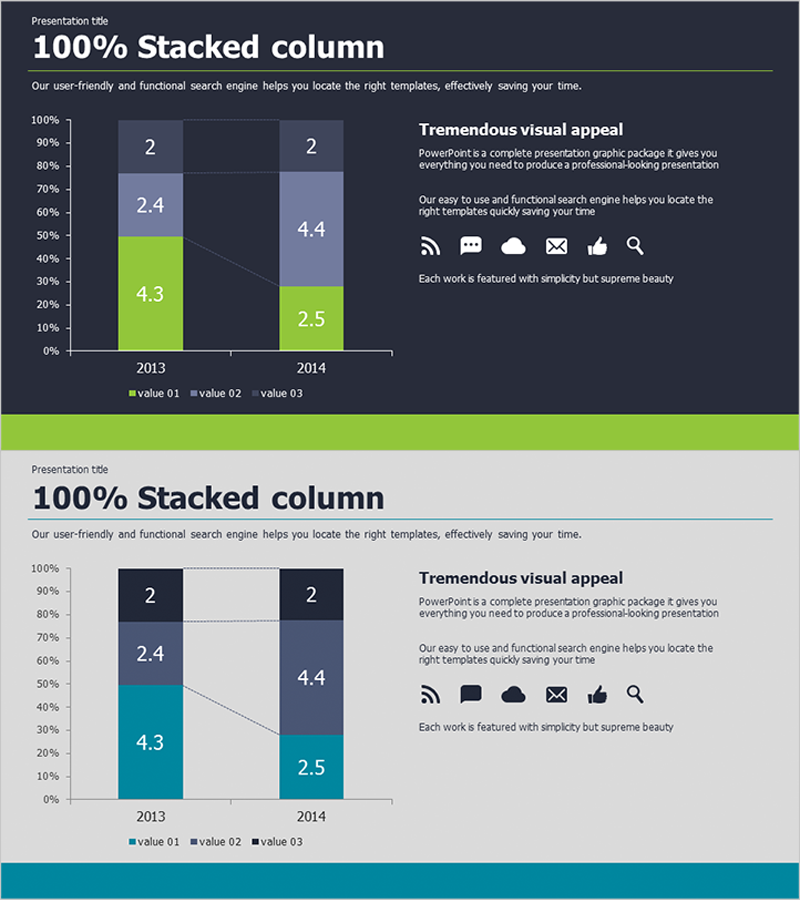
This PowerPoint slide visualizes 2013 and 2014 market data using a vertical 100% stacked column chart. Three data series (value 01, 02, 03) are displayed in cumulative format, allowing viewers to understand both overall composition ratios and individual item changes simultaneously. The high-contrast design with dark background and lime green accent color effectively communicates quantitative data for market analysis, competitor comparison, and sales performance reporting. The 16:9 widescreen 2-slide set is ready for immediate editing and presentation use.
Usage Points
-
Main Usage
Express quantitative data such as market analysis, competitor comparison, and sales performance using 100% cumulative stacked format. Simultaneously convey overall composition ratios and individual item changes. The high-contrast dark background design supports clear data communication in diverse presentation environments including conference rooms, seminars, and investor briefings.
-
How to Use
Double-click the chart to immediately edit data with your own figures. Modify legend, axis labels, and data labels as needed, and change colors to match your company brand identity for a unified presentation. The 2-slide set can also serve as supplementary slides for additional comparative analysis or detailed explanations.
-
Recommended For
Marketing, sales, and strategic planning professionals presenting market share, sales trends, and customer satisfaction changes. Financial analysts, consultants, and business development managers creating year-over-year and departmental performance comparison materials. Students and researchers incorporating statistical data into academic presentations.
-
Slide Structure
2-slide composition. Each slide features two vertical stacked columns (2013 and 2014) with three data series distinguished by color in cumulative format. Right side displays 'Tremendous visual appeal' text with 6 icons (RSS, chat, cloud, email, thumbs up, search) to emphasize key messages. 16:9 widescreen ratio optimized for modern presentation environments.
Related Products
-

Medical Services Characteristics Connection Diagram
#Market and Competitor Analysis #Graph #Customer Analysis
-

Future Outlook Segmented Bar Graph – Essential Slide for Market Analysis
#Market and Competitor Analysis #Graph #Text Box
-

Summary Table of Energy Saving Outcomes
#Market and Competitor Analysis #Financial Plans and Performance #Diagram
-

Vertical Bar Market Analysis Segmentation Graph - Data Visualization
#Market and Competitor Analysis #Graph #Competitor Analysis
