Business Analysis Segmented Vertical Bar Graph – Optimized for Market and Competitor Analysis
RJ0300062_20
- Last Update 05/05/2025
- File Size 4.7MB
- # of Slides 2
- File Format PPTX
- Slide Ratio 16:9
- Color
Keywords
About the Product
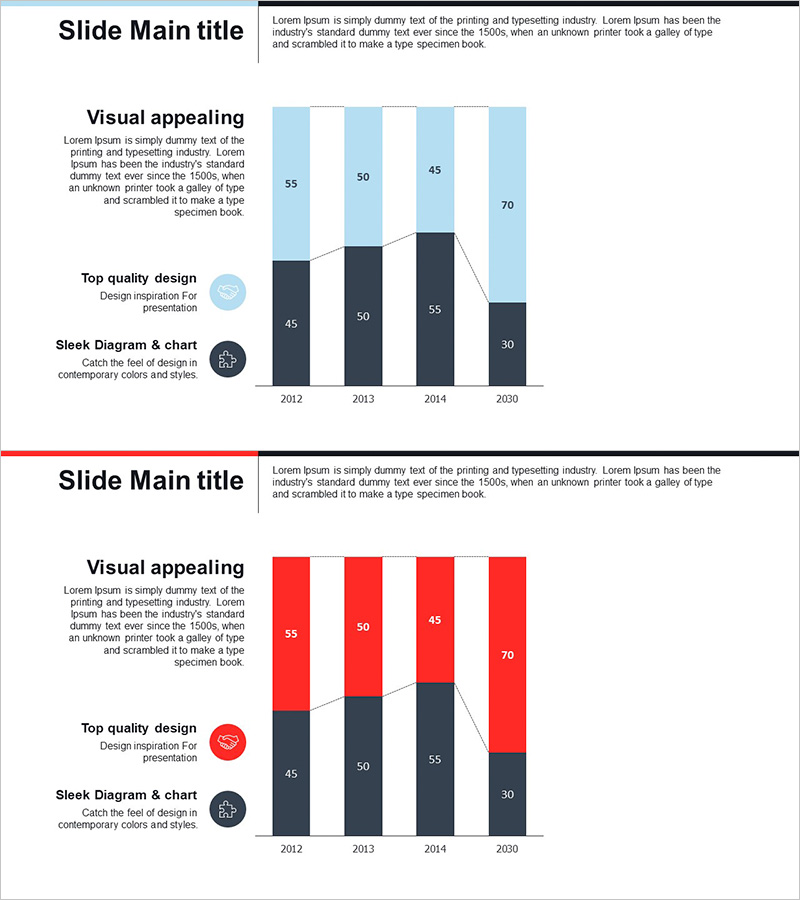
A vertical bar chart PowerPoint slide optimized for business analysis and market research presentations. This template displays data trends from 2012 to 2030 across four items using a two-tone stacked bar structure: light blue tones in the upper section and dark charcoal in the lower section. Each year's values are clearly labeled on the bars, making it ideal for competitor analysis, market size trends, revenue comparisons, and quantitative data visualization. The 2-slide set is compatible with all PowerPoint versions in 16:9 widescreen PPTX format and fully editable for seamless integration into reports and presentations.
Usage Points
-
Main Usage
This slide enables intuitive comparison of quantitative data across years and categories. The two-tone stacked bar structure—light blue upper section and dark charcoal lower section—simultaneously represents two data series, with precise numerical labels displayed above each bar. Ideal for market size trends, competitive performance benchmarking, departmental results analysis, and multi-period financial comparisons.
-
How to Use
Insert into business reports, investor pitch decks, marketing plans, and analytical presentations in the data comparison section. Double-click existing values to edit or replace with new data; colors and labels are fully customizable. Use both slides consecutively in your presentation flow or select individual slides as needed. All elements are grouped for easy repositioning and resizing.
-
Recommended For
Executives, data analysts, marketing managers, and sales leaders presenting quantitative insights for decision-making. Particularly effective for market research findings, competitive landscape analysis, quarterly or annual performance reviews, and customer segment breakdowns involving multi-item time-series data.
-
Slide Structure
Two-slide set, each containing a vertical bar chart with four data items (2012, 2013, 2014, 2030). Each bar uses a two-tone stacked design: light blue upper portion (ranges 45–70) and dark charcoal lower portion (ranges 30–55), with numerical labels positioned above. Left side includes title, descriptive text, and icon areas for contextual clarity.
Related Products
-

Vertical Bar Graph for Sector Analysis – Optimizing Data Visualization
#Market and Competitor Analysis #Graph #Competitor Analysis
-

Business Goal Setting & Analysis Graph – For Competitive Analysis
#Market and Competitor Analysis #Marketing Plan and Strategy #Graph
-

Market Analysis Segmented Bar Graph & Table Chart – Visualization of Competitive Analysis
#Market and Competitor Analysis #Diagram #Graph
-

Analysis of Courier Brand Usage Status – Insights on Competitors
#Market and Competitor Analysis #Graph #Competitor Analysis
