Vertical Bar Chart Slide | Data Comparison & Analysis PPT
RJ0300071_9
- Last Update 05/08/2025
- File Size 2MB
- # of Slides 2
- File Format PPTX
- Slide Ratio 16:9
- Color
Keywords
- #Content-Based Slides
- #Design-Based Slides
- #Business Strategy
- #Market and Competitor Analysis
- #Graph
- #Achievements
- #Market Analysis
- #Column
- #Segmented Column
- #16:9
- #vertical bar chart PowerPoint
- #bar graph slide template
- #data comparison chart
- #4-category comparison PPT
- #how to create bar chart in PowerPoint
About the Product
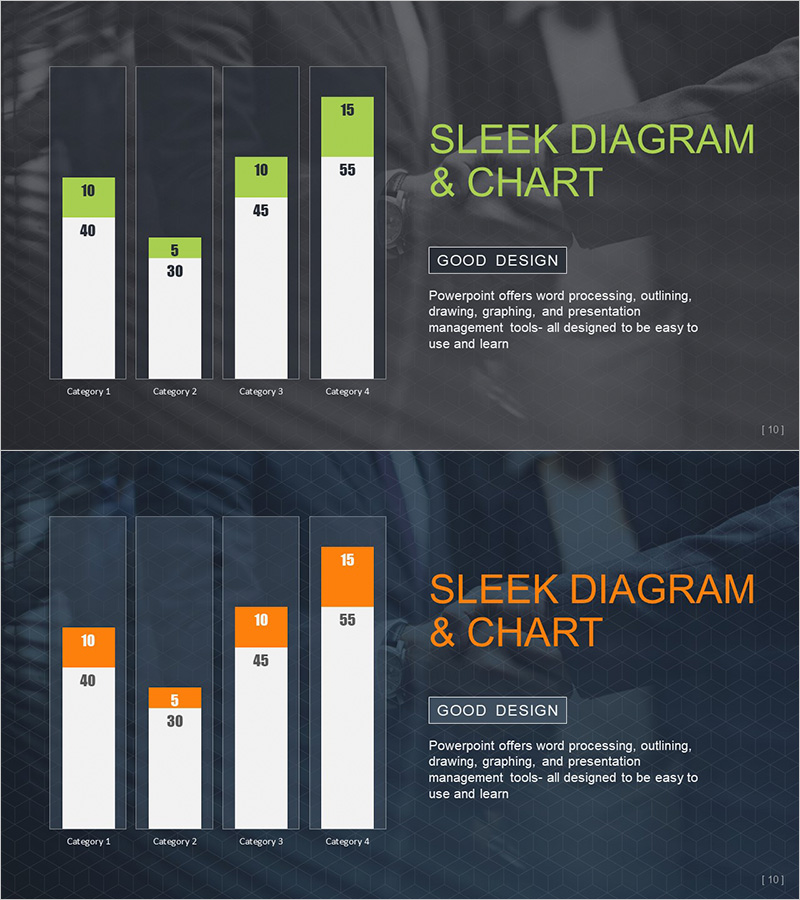
A vertical bar chart PowerPoint slide optimized for comparing numerical data across four categories. The design features lime green and orange accent colors that clearly highlight each data value, set against a dark minimalist background to enhance presentation credibility. The 2-slide set provides the same chart structure in two color variations, allowing you to select the version that best matches your presentation's color scheme. Ideal for market analysis, competitive benchmarking, partnership performance reviews, and any quantitative data visualization in business presentations.
Usage Points
-
Main Usage
Visualizes quantitative data comparison across categories with clarity and impact. The vertical bar format makes relative size differences immediately apparent, while accent colors draw attention to key metrics. Suitable for expressing market size, revenue, customer count, satisfaction scores, and other quantitative indicators.
-
How to Use
Adjust the height of each bar to reflect your actual data values. Update category labels (Category 1–4) to match your presentation context and modify the numerical labels at the top of each bar. Choose between the lime or orange version based on your overall presentation color palette.
-
Recommended For
Executive reports, business performance presentations, market analysis materials, competitive benchmarking, partnership evaluations, investor presentations, and marketing strategy pitches. Recommended for finance teams, marketing departments, strategy teams, sales teams, and any role requiring quantitative data analysis and presentation.
-
Slide Structure
2-slide set featuring identical 4-category vertical bar chart layouts in two color variations: lime green accent and orange accent. Each slide contains 4 bars (heights 10, 5, 10, 15 units), numerical labels above bars, category names below, and a title area on the right, all arranged on a dark background in 16:9 widescreen format.
Related Products
-

Market Analysis Graph with Office Worker Character – Segmented Design
#Market and Competitor Analysis #Graph #Market Analysis
-

Space Industry Analysis by Year – Market and Competition Overview
#Market and Competitor Analysis #Graph #Market Analysis
-

Flower and Market Comparison Analysis Chart – Effective Business Strategy
#Business Strategy #Market and Competitor Analysis #Graph
-

Natural Vertical Bar Segment Chart – A Key Tool for Market Analysis
#Business Strategy #Market and Competitor Analysis #Graph
