Correlation Analysis Vertical Bar Graph – Visualize Data to Enhance Competitiveness
RJ0300070_7
- Last Update 05/08/2025
- File Size 0.1MB
- # of Slides 2
- File Format PPTX
- Slide Ratio 16:9
- Color
Keywords
- #Content-Based Slides
- #Design-Based Slides
- #Product/Service Introduction
- #Market and Competitor Analysis
- #Graph
- #Development Status
- #Market Analysis
- #Column
- #Segmented Column
- #16:9
- #vertical bar chart PowerPoint
- #correlation analysis slide template
- #data comparison presentation
- #how to create bar graph in PowerPoint
- #market analysis slide template
About the Product
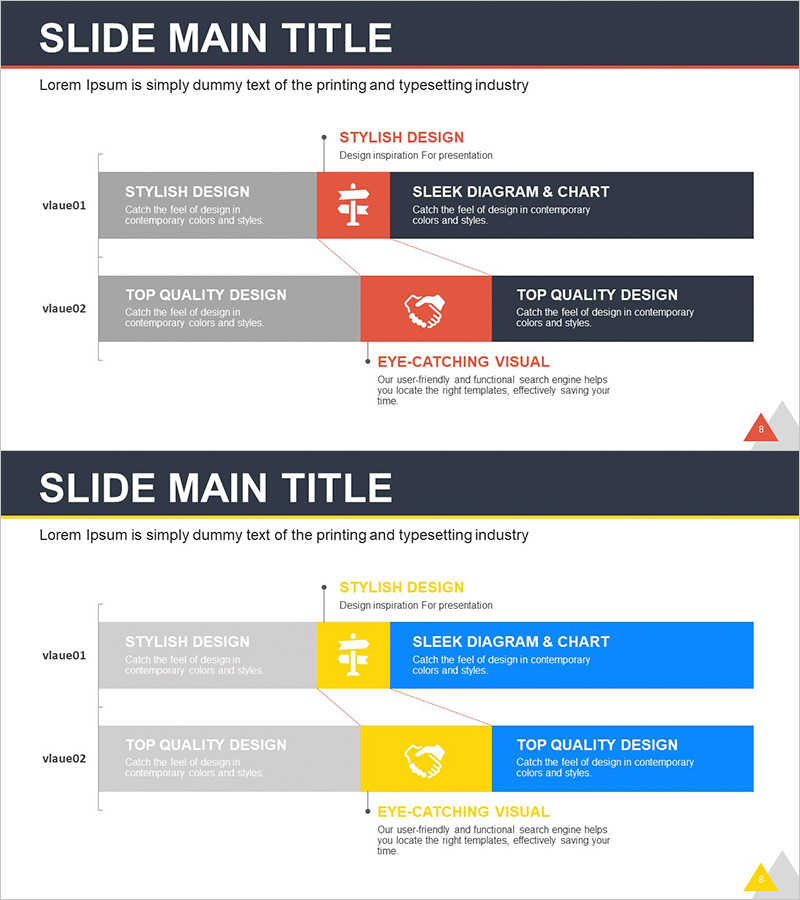
A vertical bar chart PowerPoint slide designed for correlation analysis and data comparison. This presentation template features two data series in gray and red tones, enabling clear visual representation of relationships between datasets. Ideal for market analysis, competitive benchmarking, and product positioning presentations. Provided in 16:9 widescreen PPTX format with fully editable text, values, and chart elements for immediate use in business reports and proposals.
Usage Points
-
Main Usage
Displays multiple data series side-by-side using vertical bars to compare values across categories and identify correlations. Effectively visualizes quantitative data such as market size comparisons, competitor performance metrics, product sales trends, and year-over-year growth analysis.
-
How to Use
Insert into business reports, marketing plans, and product presentations within the market analysis or competitive landscape section. Customize bar heights, numerical values, and legend labels to match your actual dataset and presentation context.
-
Recommended For
Marketing professionals, sales teams, business analysts, management consultants, data analysts, and executives preparing data-driven presentations requiring comparative analysis and correlation insights.
-
Slide Structure
Two-slide set featuring a standard vertical bar chart with gray and red series on the first slide, and a highlighted version with handshake icon emphasizing partnership or agreement on the second. Each slide includes title area, subtitle, legend, and data input zones.
Related Products
-

Bar Graph of Progress Analysis by Task - Effective Visualization of Progress
#Product/Service Introduction #Market and Competitor Analysis #Marketing Plan and Strategy
-

Social Network Market Analysis Bar Chart – Trends Insight
#Product/Service Introduction #Market and Competitor Analysis #Graph
-

Vertical Bar Chart Visualizing Monthly Performance – Contemporary Design
#Product/Service Introduction #Market and Competitor Analysis #Graph
-

Successful Teamwork Analysis Graph
#Technical Approach #Market and Competitor Analysis #Graph
