History and Development Process Visualization – Showcasing Company Milestones
RB0800080_4
- Last Update 03/28/2025
- File Size 3.2MB
- # of Slides 2
- File Format PPTX
- Slide Ratio 4:3
- Color
Keywords
About the Product
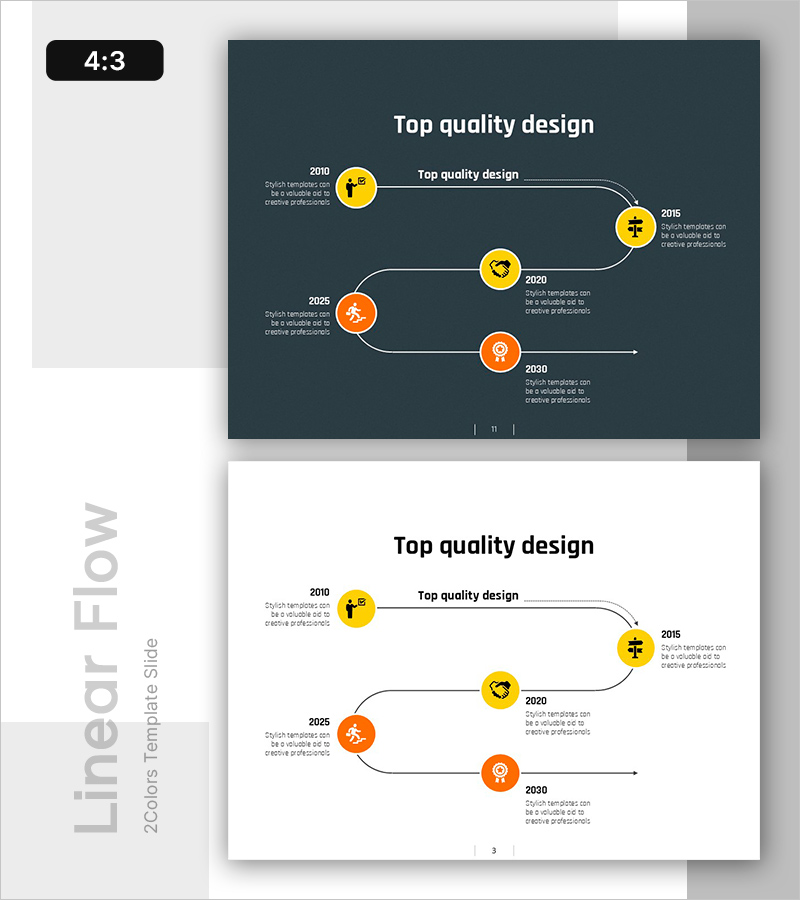
A linear timeline PowerPoint slide that visualizes your company's development journey and key milestones in chronological order. Set against a dark charcoal background, five circular nodes in yellow and orange tones are connected by flowing curves, each accommodating year labels and descriptive text. This design is ideal for company presentations, investor pitches, and annual reports where you need to communicate corporate history, growth phases, or product development roadmaps with clarity and impact. The 2-slide set offers flexibility for different presentation contexts, with fully editable text and color elements to match your brand identity.
Usage Points
-
Main Usage
The primary goal is to present your company's evolution and key achievements in a clear, chronological narrative. By arranging founding date, product launches, market expansions, and major milestones along a linear path, you help audiences quickly grasp your organization's trajectory and strategic progress.
-
How to Use
Incorporate this slide into company overview sections of investor decks, annual reports, pitch presentations, and corporate brochures. Replace placeholder years and descriptions with your actual milestones, and optionally add icons or images to enhance visual storytelling. Pair with verbal narration to deepen audience engagement and retention.
-
Recommended For
Ideal for C-suite executives, marketing managers, corporate communications teams, and investor relations professionals presenting company achievements. Particularly effective for startups showcasing growth, established companies highlighting diversification, and product teams illustrating development cycles.
-
Slide Structure
Two-slide layout featuring a dark charcoal background on slide 1 and a light background on slide 2, both displaying five circular nodes (yellow, orange, and red tones) connected by curved lines. Each node includes dedicated areas for year labels and milestone descriptions, allowing seamless customization while maintaining visual consistency.
Related Products
-

Timeline Chart Visualizing Yearly Changes – Journey of Success
#Company Introduction #Operational Plan #Diagram
-

Fintech Business History Diagram – Effective Information Delivery
#Company Introduction #Diagram #History
-

History of Past Businessmen Presentation Template - Visualizing the Flow of Time
#Company Introduction #Product/Service Introduction #Diagram
-

Arrow Connection History Diagram – Step-by-Step Business Strategy
#Company Introduction #Business Strategy #Diagram
