Ship Logistics Equipment Status Analysis – Facility and Market Overview
RB0800078_5
- Last Update 03/28/2025
- File Size 0.8MB
- # of Slides 2
- File Format PPTX
- Slide Ratio 4:3
- Color
Keywords
- #Content-Based Slides
- #Design-Based Slides
- #Business Introduction
- #Market and Competitor Analysis
- #Graph
- #Other
- #Facilities & Equipment
- #Market Analysis
- #4:3
- #market analysis PowerPoint slide
- #logistics market analysis presentation
- #shipping competitive analysis slide
- #comparison layout market analysis PPT
- #how to create market analysis in PowerPoint
About the Product
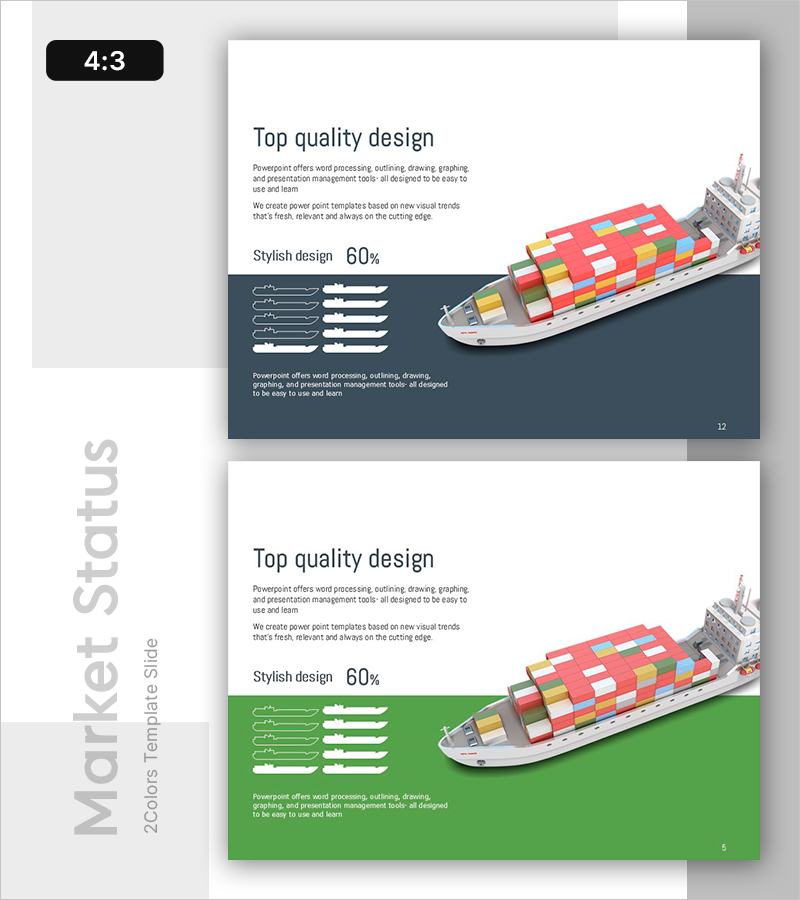
A PowerPoint slide set designed for logistics and maritime industry market analysis. The 2-slide composition features a text description area at the top and a comparison data visualization section at the bottom with dark blue and green backgrounds. Each slide incorporates a cargo ship image alongside horizontal bar charts and percentage indicators, optimized for competitive analysis and market positioning presentations. Available in 4:3 ratio PPTX format for immediate editing, suitable for facility status reports and market strategy presentations.
Usage Points
-
Main Usage
Visualizes logistics and maritime market conditions and competitive positioning through data-driven analysis. The top text area explains analytical context while the bottom section uses charts and bar graphs to present comparative metrics, supporting strategic decision-making.
-
How to Use
Apply to market overview and competitive analysis sections in business plans, investment pitch decks, and market research reports. Input analysis topics and conclusions in the top text area, then populate the bottom chart section with actual data (market share, growth rates, competitive metrics) to enhance audience comprehension.
-
Recommended For
Recommended for logistics, shipping, and maritime company executives, strategy teams, consultants, and investor presentation specialists. Effectively strengthens data credibility in market entry strategy, competitive positioning, and business feasibility presentations.
-
Slide Structure
2-slide set where each slide contains a top section with title and descriptive text (3-4 lines) and a bottom data visualization area (5 horizontal bars with percentage indicators). Dark blue and green background sections distinguish comparison analysis for enhanced clarity.
Related Products
-

Horizontal Bar Chart Visualizing US Target Market Progress
#Market and Competitor Analysis #Graph #Other
-

White Black Area Graph – Visualizing Market Analysis
#Market and Competitor Analysis #Graph #Other
-

Donut Chart & Map Template for Social Network Visualization
#Market and Competitor Analysis #Graph #Other
-

Galaxy Theme Market Analysis Area Graph
#Market and Competitor Analysis #Graph #Other
