Galaxy Theme Market Analysis Area Graph
RJ0400001_5
- Last Update 05/17/2025
- File Size 13.8MB
- # of Slides 2
- File Format PPTX
- Slide Ratio 16:9
- Color
Keywords
About the Product
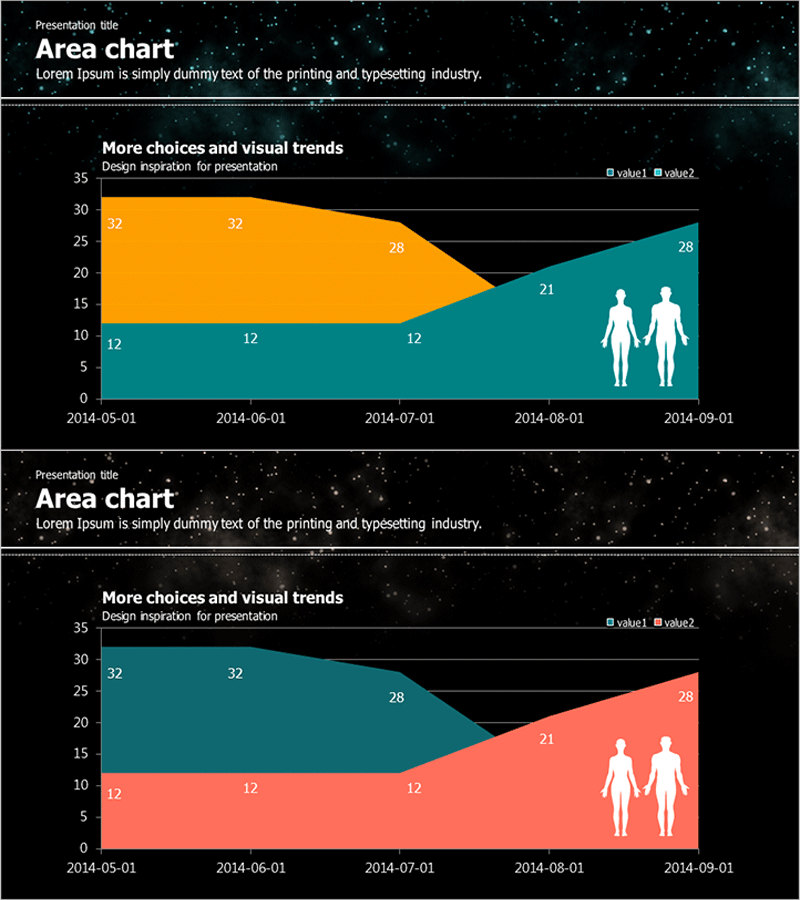
An area chart PowerPoint slide optimized for market analysis and data comparison presentations. The slide features a black background with orange and teal-colored area layers that intuitively display data trends over time. Comprising 2 slides, each chart includes numerical labels and legends for immediate use in presentations. The galaxy theme's cosmic atmosphere combined with clear data visualization conveys credibility in investor pitches, market status reports, and executive briefings. The dual-area design allows simultaneous comparison of two data series while showing cumulative trends.
Usage Points
-
Main Usage
Used for presentations comparing two data series over time, such as market conditions, competitor analysis, and customer segment trends. Area charts simultaneously display cumulative data and individual series changes, serving as evidence for strategic decision-making.
-
How to Use
Input actual data into the chart area and the graph automatically updates. Modify legends and numerical labels to match your analysis, and customize the color palette while maintaining the galaxy theme background. All elements are fully editable for your specific presentation needs.
-
Recommended For
Marketing managers, executives, investor relations specialists, consultants, and data analysts presenting market analysis results, revenue trends, and customer insights. Particularly suitable for periodic reports, investor presentations, and strategic planning meetings.
-
Slide Structure
Consists of 2 slides, each with one title area and one dual-area chart. Charts include X-axis (time or categories), Y-axis (numerical values), two data series (orange and teal), legend, and numerical labels for clear communication of complex data.
Related Products
-

Target Market Share Analysis Graph – Strategic Market Insights
#Market and Competitor Analysis #Graph #Other
-

Stack Bar Chart Map for Market and Competitor Analysis
#Market and Competitor Analysis #Marketing Plan and Strategy #Graph
-

Curved Hill Shape Graph – Market Trend and Growth Analysis
#Market and Competitor Analysis #Graph #Other
-

User Analysis Donut Chart – Optimal for Market and Competitor Analysis
#Market and Competitor Analysis #Graph #Other
