Horizontal Bar Chart Visualizing US Target Market Progress
RJ0700013_27
- Last Update 07/25/2025
- File Size 1.2MB
- # of Slides 2
- File Format PPTX
- Slide Ratio 16:9
- Color
Keywords
- #Content-Based Slides
- #Design-Based Slides
- #Market and Competitor Analysis
- #Graph
- #Other
- #Market Analysis
- #Target Market
- #Horizontal Bar
- #Horizontal Bar Chart
- #Map
- #16:9
- #US map PowerPoint slide
- #horizontal bar chart template
- #market progress visualization
- #regional data comparison
- #sales performance slide template
About the Product
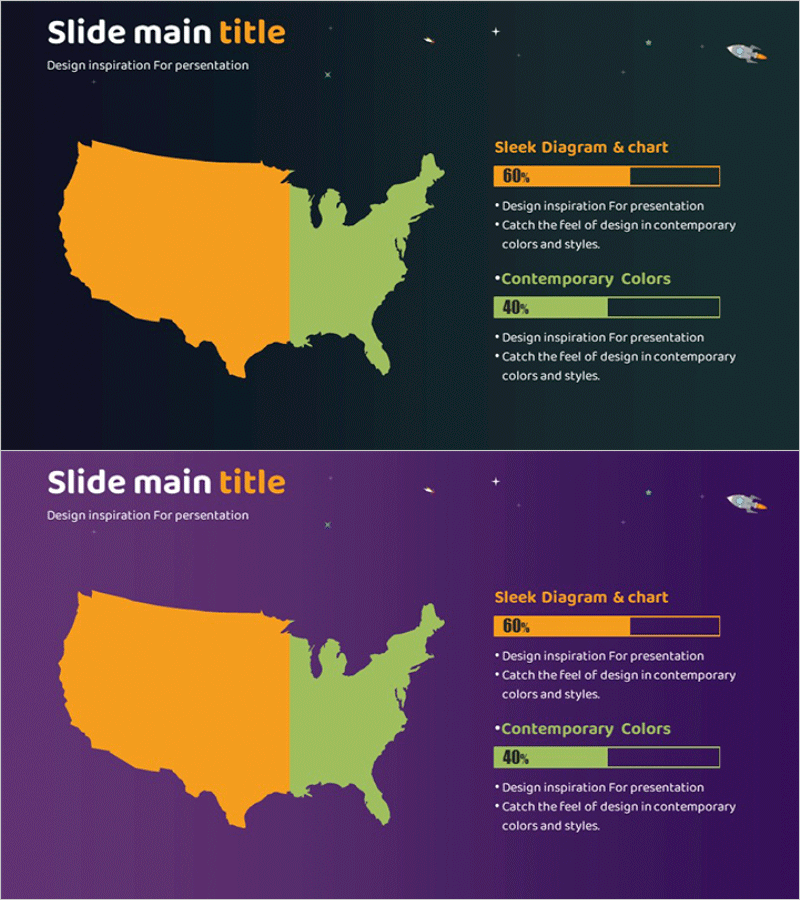
A horizontal bar chart PowerPoint slide visualizing US target market progress by region. The slide features a dark background with orange and lime green color-coded bars for clear data comparison. Delivered as a 2-slide PPTX deck in 16:9 format, this presentation template is ready for immediate use in market analysis, sales progress reporting, and regional performance reviews. Percentage values and legend annotations are included to support data-driven decision-making presentations.
Usage Points
-
Main Usage
Visualize US regional market progress, sales target achievement rates, and cross-region performance metrics using a horizontal bar chart format. The dual-color design (orange and lime green) enables instant data comparison, making it ideal for executive briefings, sales team meetings, and market analysis presentations.
-
How to Use
Open the slide and replace existing region names and numerical values with your own data. Bar lengths and colors adjust automatically, and you can modify the legend and percentage displays to match your metrics. The dark background provides high contrast for excellent readability in projector presentations.
-
Recommended For
Sales managers, marketing strategists, regional directors, and business analysts presenting market progress and regional performance metrics. Suitable for quarterly performance reviews, annual target achievement assessments, and regional expansion strategy presentations.
-
Slide Structure
2-slide deck. Slide 1 features a dark teal background with US map and dual horizontal bars (orange 60%, lime green 40%) with percentage labels and legend. Slide 2 uses a purple background with identical map and chart layout for color variation. Both slides include title area, legend, percentage values, and descriptive text zones.
Related Products
-

Target Market and Percentage Bar - Visual Diagram for Market Analysis
#Market and Competitor Analysis #Graph #Other
-

Botanic Garden Wide PPT Map – A Visual Tool for Effective Market Analysis
#Market and Competitor Analysis #Diagram #Other
-

Brown Background Global Market Analysis – Utilizing Cluster Diagrams
#Market and Competitor Analysis #Diagram #Other
-

Analysis of US Target Regions – Slide Template for Market and Competitor Analysis
#Market and Competitor Analysis #Graph #Other
