Demand Analysis by Item Using Donut Chart
RB0800076_7
- Last Update 03/28/2025
- File Size 0.3MB
- # of Slides 2
- File Format PPTX
- Slide Ratio 4:3
- Color
Keywords
About the Product
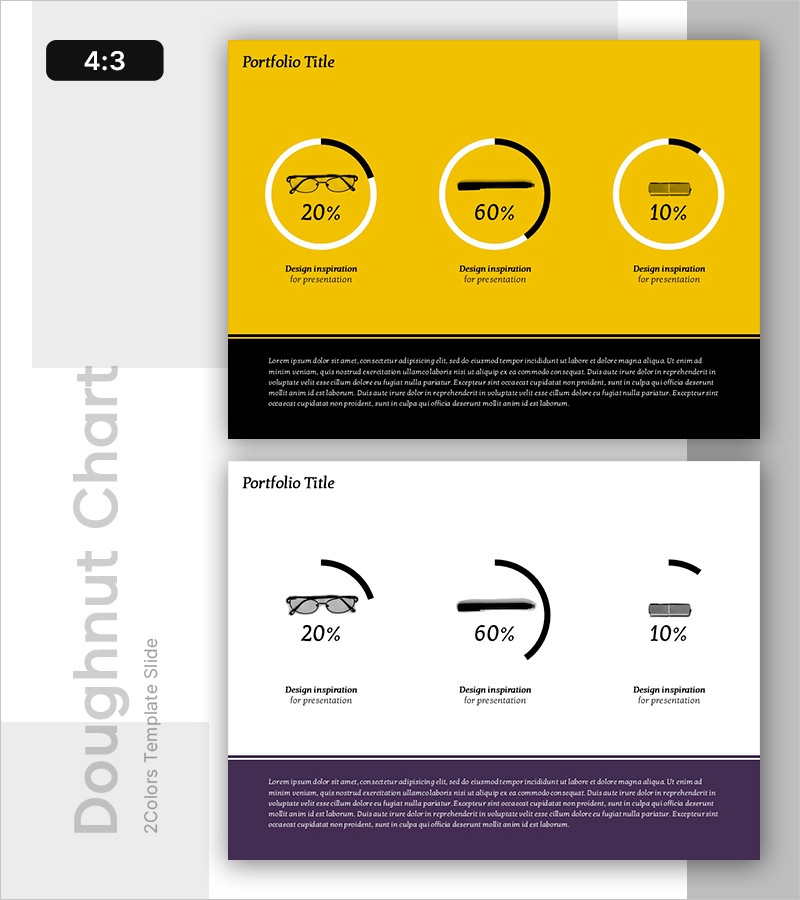
A pie chart slide that visually represents the proportion of three items with clear data visualization. Featuring a yellow background with white circular borders and black progress indicators, this PowerPoint template effectively displays percentage data such as 20%, 60%, and 10%. Ideal for market analysis, demand assessment, and market share comparisons in presentations. The 2-slide set includes both yellow and white background versions, with fully editable text and numerical fields for immediate use in business reports and strategic presentations.
Usage Points
-
Main Usage
Visualize the composition ratio of three items such as market analysis, product demand, and market share comparison. This pie chart slide effectively communicates numerical data to audiences and enhances comprehension of proportional relationships.
-
How to Use
Edit the percentage values and labels in each pie chart with your own data. Choose between the yellow background or white background version depending on your presentation context and design preference.
-
Recommended For
Recommended for marketing plans, business reports, market analysis presentations, product demand analysis, and customer composition analysis. Suitable for executives, marketing professionals, and data analysts who need to emphasize proportion-based data.
-
Slide Structure
2-slide set featuring one yellow background slide and one white background slide. Each slide contains three pie charts arranged horizontally, with white borders and black progress indicators representing the proportion of each segment.
Related Products
-

Construction Site Donut Chart – Market Share Visualization
#Market and Competitor Analysis #Graph #Market Status
-

Donut Chart: Feature Usage Ratio in Mobile Banking
#Market and Competitor Analysis #Diagram #Graph
-
![Analysis of [3 Key Factors] with Donut Chart - Market Status and Share](https://image.goodpello.com/2025/08/16/9c5d48b8-118b-499e-a39c-4b78a2acdc1e.jpg?w=300&h=336&format=auto)
Analysis of [3 Key Factors] with Donut Chart - Market Status and Share
#Market and Competitor Analysis #Graph #Market Status
-

Sales Status by Food Truck Product – Market Share Analysis
#Market and Competitor Analysis #Graph #Market Status
