Weather Analysis Donut Chart – Visualizing Market Status and Share
RJ0600107_26
- Last Update 07/20/2025
- File Size 0.5MB
- # of Slides 2
- File Format PPTX
- Slide Ratio 16:9
- Color
Keywords
About the Product
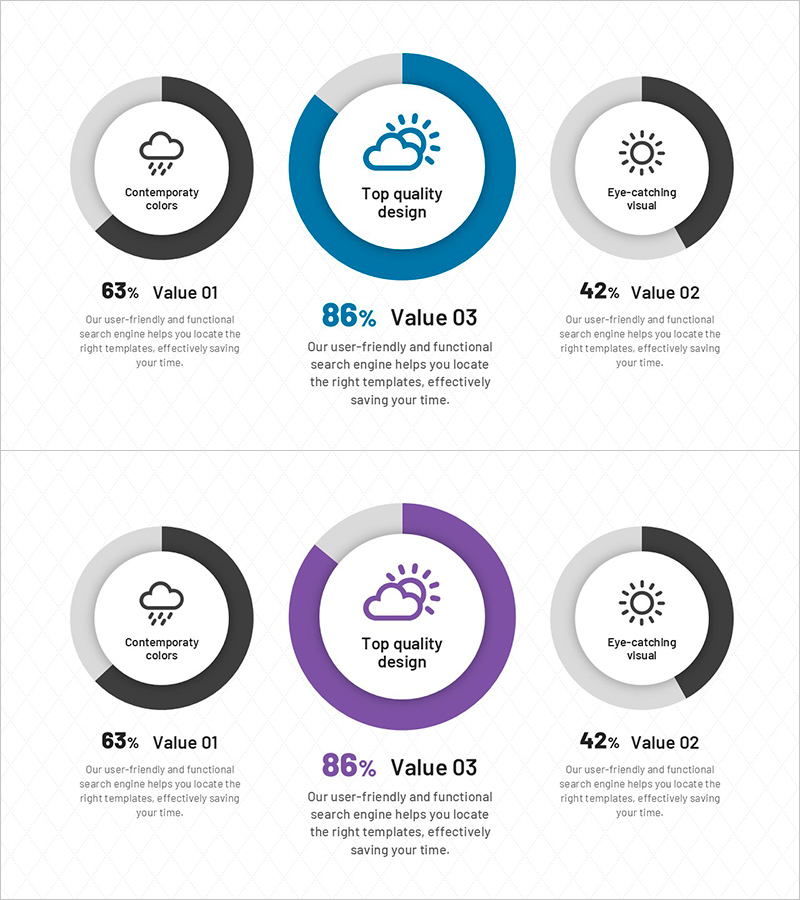
A 3-segment donut chart PowerPoint slide that visualizes market status and share distribution with clarity and impact. The contrasting color palette of blue, black, and gray distinctly separates each data segment, while the central circular area accommodates key metrics or titles. Comprising 2 slides, this template adapts to various data scenarios and is ideal for business reports, marketing analysis, and strategic presentations. The 16:9 widescreen PPTX format enables immediate editing and seamless integration into your presentation workflow.
Usage Points
-
Main Usage
Displays 3–4 data items as proportional segments within a donut ring, enabling instant comprehension of overall composition. The central circular area highlights key metrics, percentages, or titles, creating a focal point that emphasizes critical information.
-
How to Use
Modify segment colors and adjust proportions to match your actual data. Insert percentages, currency values, or units in the central area, and add legend labels or descriptive text to align with your presentation context. Embed into marketing, sales, or executive reporting slides.
-
Recommended For
Marketing managers, sales directors, executives, financial analysts, and consultants presenting market analysis, competitive benchmarking, budget allocation, and customer segmentation data. Ideal for quarterly performance reviews, strategy meetings, and investor presentations requiring multi-segment ratio visualization.
-
Slide Structure
Two slides featuring 3-segment donut charts. Each slide uses blue, black, and gray color coding to differentiate data categories, with a central circular zone for metrics, titles, or icons. Includes label areas, legend space, and descriptive text regions for customization.
Related Products
-

Visualizing Fish Market Share with Doughnut Chart – Vitality of the Ocean
#Market and Competitor Analysis #Graph #Market Status
-

Donut Chart for Components and Market Share Visualization – Market Analysis
#Market and Competitor Analysis #Graph #Market Status
-

Visualizing Value Ratios with Pie Charts – Essential Presentation Template
#Market and Competitor Analysis #Diagram #Graph
-

Logistics Market Share Chart – Current Status and Competitive Analysis
#Market and Competitor Analysis #Graph #Market Status
