Market Analysis through Victim's Body Damage Level Chart – Infographic Use
RJ0800010_7
- Last Update 08/02/2025
- File Size 0.7MB
- # of Slides 2
- File Format PPTX
- Slide Ratio 16:9
- Color
Keywords
About the Product
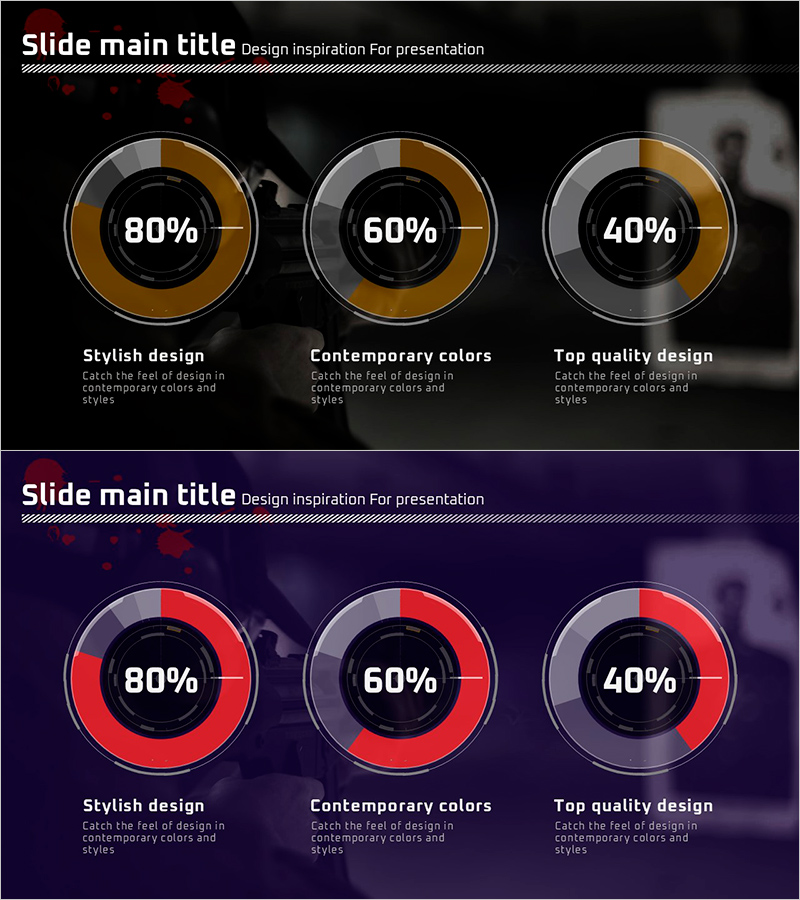
A PowerPoint slide featuring three donut-shaped pie charts that visualize percentage data with dual-tone color schemes. The gold and red segmented circles display values like 80%, 60%, and 40% against a dark background, creating a contemporary and impactful presentation style. Each chart includes a text label area below for item descriptions. This slide template is ideal for business reports, market analysis presentations, marketing proposals, and performance dashboards where you need to compare proportions, market share, or key metrics across multiple categories.
Usage Points
-
Main Usage
Visualize composition ratios, market share percentages, performance metrics, or survey results across three categories using donut-shaped pie charts. The hollow center allows you to add key figures, titles, or additional data points for enhanced information delivery.
-
How to Use
Insert this slide into the analysis or results section of your presentation to display data proportions at a glance. Customize the segment labels and description text below each chart to match your specific data. The dark background ensures clear visibility on projection screens and digital displays.
-
Recommended For
Marketing managers, sales leaders, financial analysts, management consultants, and project managers presenting market analysis, performance reports, customer satisfaction surveys, or budget allocations. Suitable for corporate presentations, strategy meetings, and client pitches.
-
Slide Structure
Two-slide layout. First slide features three gold-toned donut charts; second slide displays three red-toned donut charts. Each chart consists of a central circular area with outer segments representing data proportions, plus editable text fields below for labels and descriptions.
Related Products
-

Doughnut Chart Visualizing Proportion of Grain Yields
#Market and Competitor Analysis #Graph #Market Status
-

Enrollment Stats & Ratios Donut Chart
#Market and Competitor Analysis #Graph #Market Status
-

Guide to Admission Evaluation Criteria with Donut Chart
#Market and Competitor Analysis #Graph #Market Status
-

Pie Chart for Decimal Ratio Analysis – Market Share Status
#Market and Competitor Analysis #Graph #Market Status
