Gender-Based Automotive Demand Analysis Slide
RB0800075_6
- Last Update 03/28/2025
- File Size 0.5MB
- # of Slides 2
- File Format PPTX
- Slide Ratio 4:3
- Color
Keywords
- #Content-Based Slides
- #Design-Based Slides
- #Market and Competitor Analysis
- #Graph
- #Other
- #Customer Analysis
- #Market Analysis
- #4:3
- #gender analysis PowerPoint slide
- #automotive demand analysis presentation
- #market comparison slide
- #gender-based market research PPT
- #automotive marketing analysis slide
About the Product
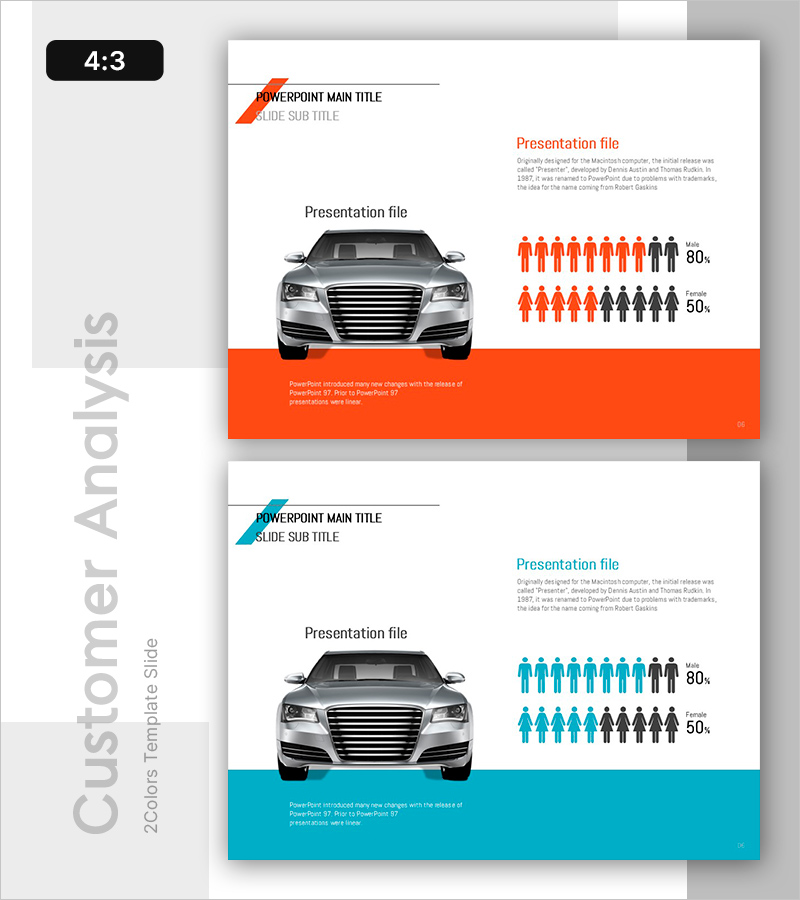
A two-slide PowerPoint presentation designed to visualize gender-based automotive demand analysis. Each slide features a vehicle image on the left and gender demographic icons with percentage data on the right, presented in orange and blue color variants. The layout clearly separates title, body text, imagery, and data zones for easy customization. Ideal for automotive marketing strategies, market research presentations, and sales analysis reports that require visual comparison of male and female purchasing patterns.
Usage Points
-
Main Usage
This slide enables data-driven analysis and explanation of gender-based automotive demand differences. It supports market segmentation, target customer identification, and marketing strategy development, delivering market insights to investors, executives, and sales teams.
-
How to Use
Use this slide in the market analysis section when discussing gender-specific purchasing patterns. Enter product or model names in the left vehicle image area, and input actual survey data (percentages) in the right demographic zone. Colors and text are fully editable to adapt to different products and markets.
-
Recommended For
Automotive manufacturers, dealership marketing teams, market research professionals, automotive finance companies, and management consultants. Suitable for new vehicle launch presentations, quarterly sales strategy meetings, investor relations (IR) presentations, and market analysis report slideshows.
-
Slide Structure
Two-slide format with consistent layout: top title area (orange/blue triangular banner), center image zone (vehicle photograph), and right data section (gender icons with percentage figures). Provided in 4:3 aspect ratio PPTX format with fully editable text, images, and numerical data.
Related Products
-

Gender Ratio Customer Analysis 3D Circle Graph – Insights for Market Understanding
#Market and Competitor Analysis #Graph #Other
-

Graphic Designer Demand Analysis Slide – Market Insights and Customer Statistics
#Market and Competitor Analysis #Graph #Other
-

Comparative Chart of Male and Female Professionals
#Market and Competitor Analysis #Graph #Other
-

Silhouette Step Diagram – Effective Tool for Market Analysis
#Market and Competitor Analysis #Graph #Other
