Game Service Operation and Product Sales Performance – Data Visualization
RJ0400017_15
- Last Update 05/21/2025
- File Size 0.6MB
- # of Slides 2
- File Format PPTX
- Slide Ratio 16:9
- Color
Keywords
- #Content-Based Slides
- #Design-Based Slides
- #Company Introduction
- #Business Strategy
- #Graph
- #Other
- #Key Achievements
- #Achievements
- #16:9
- #game service performance PowerPoint slide
- #area chart visualization
- #sales performance data slide
- #game industry presentation
- #how to create performance charts in PowerPoint
About the Product
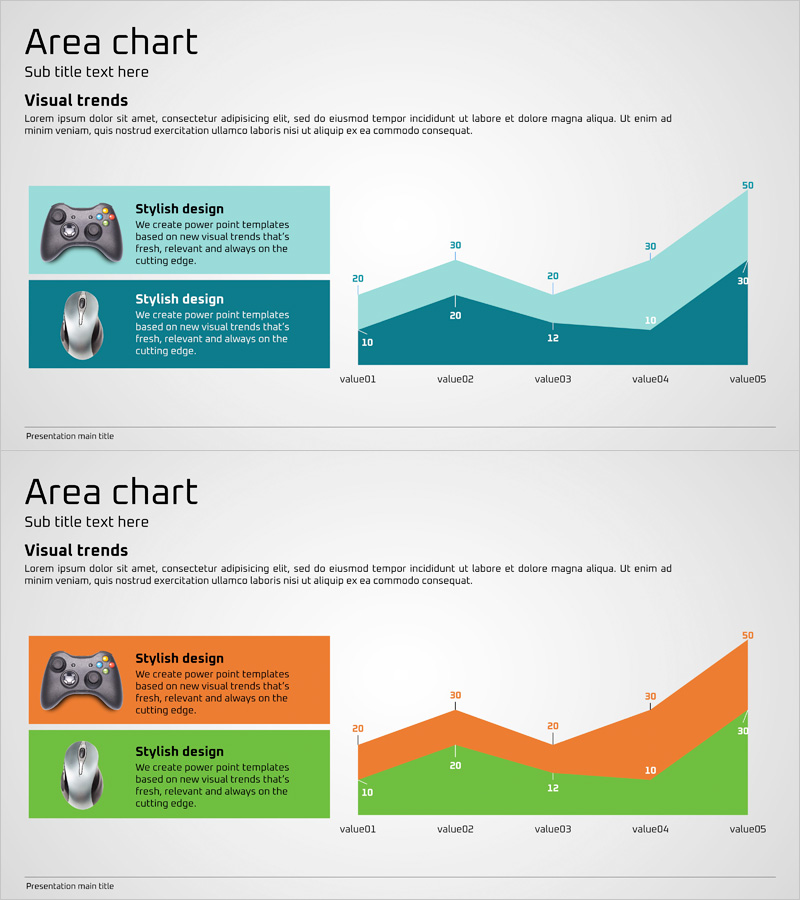
A PowerPoint slide that visualizes game service operations and product sales performance using a two-layer area chart. The design features teal and orange color schemes to represent data trends over time, with icon and text description areas on the left side to emphasize key information. Provided in 16:9 widescreen PPTX format, this presentation slide is ready to use in game industry reports, business performance presentations, investor pitch decks, and quarterly earnings calls.
Usage Points
-
Main Usage
This data visualization slide displays game service operations and product sales performance across different time periods using a comparative area chart. The layered area chart allows simultaneous representation of multiple metrics, making performance changes intuitive and easy to understand.
-
How to Use
Use this slide in business performance reports, quarterly earnings presentations, investor relations meetings, and executive briefings to effectively visualize game industry performance data. Input key insights in the left text area to accompany the chart and provide comprehensive analysis.
-
Recommended For
Recommended for game developers, game publishers, and gaming platform operators including executives, planning teams, and marketing departments preparing performance analysis materials. Also valuable for game industry analysis reports and the performance section of business plans.
-
Slide Structure
Two-slide set where each slide contains two text input areas on the left (with icons) and an area chart on the right. The chart displays five data points across two layers with numerical labels included for accurate data communication.
Related Products
-

Graph Slide Visualizing Performance and Future Prospects in Pink and Bluegreen
#Company Introduction #Business Strategy #Graph
-

Business Data Overview Slide - Performance Visualization
#Company Introduction #Business Strategy #Graph
-

Circular Graph by Instrument – Performance and Strategy
#Company Introduction #Business Strategy #Graph
-

Performance and Future Prospects Green Navy – Business Strategy through Data Visualization
#Company Introduction #Business Strategy #Graph
