Visualizing Facility Performance Metrics and Process Stages - Business Outcomes and Goals
RB0800072_8
- Last Update 03/28/2025
- File Size 3.2MB
- # of Slides 2
- File Format PPTX
- Slide Ratio 4:3
- Color
Keywords
- #Content-Based Slides
- #Design-Based Slides
- #Business Vision and Strategy
- #Business Strategy
- #Diagram
- #Graph
- #Business Goals
- #Achievements
- #Structure
- #Column
- #Pyramid Chart
- #Column Chart
- #4:3
- #circular diagram PowerPoint
- #stacked diagram slide template
- #5-stage process visualization
- #facility performance metrics
- #how to create process diagram in PowerPoint
About the Product
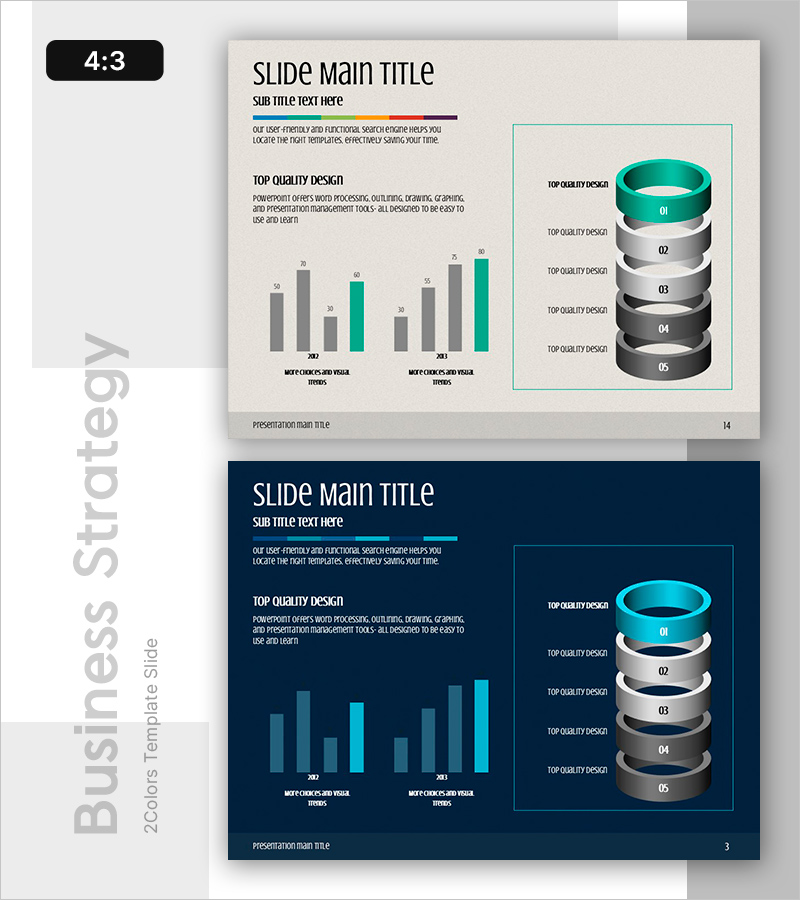
A PowerPoint slide that visualizes facility performance metrics and process stages using a 5-stage circular stacked diagram structure. The 3D circular design features a teal top ring and gray stacked rings, intuitively representing organizational goal achievement stages. Combined with a bar chart, it effectively supports comparative analysis of performance indicators and is ready to use in business strategy and vision presentation slides. The 4:3 aspect ratio with 2-slide composition reduces presentation development time.
Usage Points
-
Main Usage
Clearly communicate organizational facility performance metrics and process stages through hierarchical representation, emphasizing cumulative stage-by-stage achievement. The 5-stage circular stacked structure provides credible data visualization for executive reports and strategic presentations.
-
How to Use
Introduce the 5-stage process using the circular diagram on slide 1, then compare performance metrics by stage with the bar chart on slide 2. Enter department names, target values, and achievement rates in text areas to reflect actual data, making it immediately usable for business performance reports or strategy meetings.
-
Recommended For
Ideal for executives, planning teams, and operations teams reporting on business performance and facility efficiency. Particularly effective for multi-stage process improvement, goal achievement tracking, and organizational vision presentations. Valuable for manufacturing, logistics, and construction industries presenting facility-focused performance.
-
Slide Structure
Slide 1: 3D circular diagram with teal top ring and 5 gray stacked rings, 5 text input areas on right / Slide 2: Bar chart on left (2 series, 8 data points) with identical circular diagram on right for visual consistency
Related Products
-

Target Sales Vertical Bar Graph - Visualizing Business Performance
#Business Vision and Strategy #Business Strategy #Diagram
-

Bar and Column Charts Investigating Important Factors in Marriage
#Business Vision and Strategy #Business Strategy #Graph
-

Visualizing Achievements through Design Innovation – Reflecting Latest Trends
#Business Strategy #Market and Competitor Analysis #Diagram
-

Core Element Traits Diagram – Product and Service Introduction
#Product/Service Introduction #Business Vision and Strategy #Diagram
