Bar and Column Charts Investigating Important Factors in Marriage
RJ0800009_21
- Last Update 08/02/2025
- File Size 0.5MB
- # of Slides 2
- File Format PPTX
- Slide Ratio 16:9
- Color
Keywords
- #Content-Based Slides
- #Design-Based Slides
- #Business Vision and Strategy
- #Business Strategy
- #Graph
- #Business Goals
- #Financial Outlook & Expected Impact
- #Column
- #Column Chart
- #16:9
- #column chart PowerPoint
- #vertical bar graph slide template
- #5-item comparison chart
- #data visualization PowerPoint
- #how to create column chart in PowerPoint
About the Product
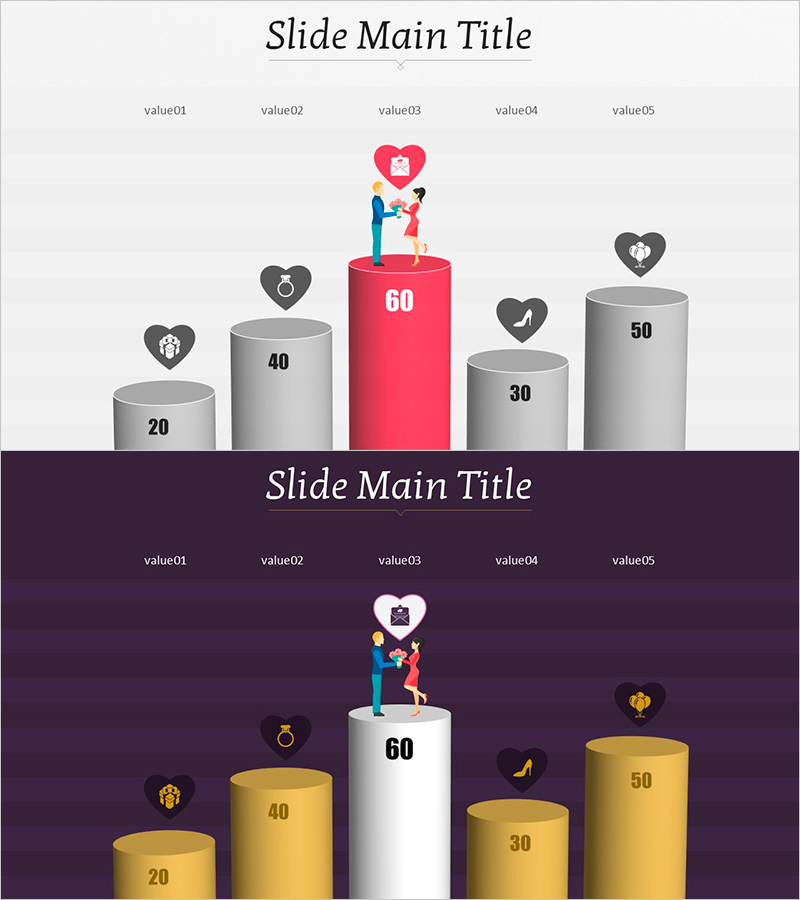
A vertical column chart PowerPoint slide comparing five important factors in marriage through data visualization. The slide features a light gray background with a central pink-highlighted column and gray columns on both sides, each topped with heart icons and numerical values (20, 40, 60, 30, 50). Two color scheme versions are provided—light tone and dark tone—allowing you to match your presentation's overall aesthetic. This ready-to-use slide template is perfect for any presentation requiring data comparison and ranking visualization.
Usage Points
-
Main Usage
Designed to compare quantitative data across five items and visually represent rankings. Ideal for survey results, statistical analysis, performance comparisons, and any presentation requiring numerical data visualization and clear comparative insights.
-
How to Use
Edit the column heights and numerical values to match your actual data. Use the light tone version for bright, positive presentations and the dark tone for professional business contexts requiring credibility. Heart icons can be replaced with alternative symbols matching your presentation theme.
-
Recommended For
Recommended for marketing research, customer satisfaction surveys, product feature comparisons, questionnaire result analysis, and performance evaluation presentations. Effective for HR, marketing, sales, and planning departments presenting data-driven reports and analyses.
-
Slide Structure
Two-slide set providing both light tone (bright background) and dark tone (dark background) versions. Each slide consists of five vertical columns with the center column highlighted in pink and side columns in gray tones. Optimized for 16:9 widescreen format with professional spacing and alignment.
Related Products
-

Future Outlook Vertical Bar Graph – Business Strategy Analysis
#Business Strategy #Market and Competitor Analysis #Graph
-

Utilization Rate of Oriental Medicine Clinics by Age – Market and Competitor Analysis
#Business Strategy #Market and Competitor Analysis #Graph
-

Orange & Green Future Outlook Bar Graph
#Business Strategy #Market and Competitor Analysis #Graph
-

Technology Service Future Outlook and Expected Effect – High-Quality Graph Design
#Business Strategy #Market and Competitor Analysis #Graph
